Exploring Early Galaxies with the CCAT
Activity: WIDE AREA GALAXY SURVEYS
The wide area capability of CCAT will make it especially useful to conduct deep, large
area surveys of the submillimeter sky. In this activity, we will explore a few datasets
gleaned from existing large area surveys at optical and radio wavelengths to explore
in general terms how surveys of large numbers of galaxies can be used to learn about
their formation and evolutionary history.
Find this activity at:
http://egg.astro.cornell.edu/alfalfa/ugrad/REUworkshops/ccat14_1.htm
Useful links
- CCAT
- SDSS, the Sloan Digital Sky Survey
- ALFALFA, the Arecibo Legacy Fast ALFA extragalactic HI survey
- NASA/IPAC infrared science archive
- MAST, the Mikulski archive for space telescopes
- NED, the NASA extragalactic database
- VAO, the US Virtual Astronomical Observatory
- TOPCAT,
the Tool for OPerations on Catalogues And Tables
- DS9, astronomical
imaging and data visualization application (we won't use this today, but it's good to know about)
Using TOPCAT (Excel for Astronomers)
During this activity, we will use TOPCAT to generate some plots.
Developed as part of the international virtual observatory effort, TOPCAT is
a java application that is specifically designed for astronomical use and it should run on any platform.
If possible, download it on your laptop before coming to the workshop. Then let's use it!
Demonstrating TOPCAT: Exploring the ALFALFA universe
A couple of weeks ago you had some introduction to observing the 21cm HI line, and the ALFALFA survey. ALFALFA is
a survey of 1/5 of the sky looking for extragalactic 21cm emission, that is, emission from neutral hydrogen in galaxies.
Here, we will use TOPCAT explore a few things about the ALFALFA dataset which will likewise provide some insight into any
flux/magnitude limited survey.
- Go to the
ALFALFA data page. Take a quick look at the
ASCII version of Table 1 (N.B. it has a description of the table contents) and then
download Table 1 in CSV format. What does "csv" stand for?
- One of the features of TOPCAT as an astronomical tool is that it understands what
right ascension and declination are. The CSV format includes a first line which contains column headers.
As long as we have been clever enough (and of course, we have been) to label the columns for RA,Dec intelligently
(e.g., RAdeg_HI, Decdeg_HI), TOPCAT will quickly realize these are astronomical coordinates.
Load the CSV table into TOPCAT and make a SKY plot. What do you notice?
- Next, make a Spaenhauer diagram, plotting
on the x-axis the distance to the galaxy and on the y-axis the log of the HI mass. What do you notice?
How can you interpret the various structural features that are evident?
While we might spend the rest of the day exploring ALFALFA data (and many of us do, every day...), let's move on
to learn a bit about the optical Sloan Digital Sky Survey (SDSS). As we move forward, we need to keep
in mind the lesson about survey depth that the Spaenhauer diagram teaches us.
Demonstrating SQL: Finding a few, very massive galaxies (in a very small volume)
The SDSS Data Release 7 (DR7) database contains
images and photometry in five optical bands (u, g, r, i, z) for 357 million objects and
spectroscopy for a million objects (930,000 galaxies, 120,000 quasars and lots of stars!). After DR7 the
instruments on the telescope dedicated to the SDSS survey underwent a major upgrade, which resulted in
quite a bit more data, which was released in SDSS
DR8 through DR10. SDSS is now undergoing another instrument
upgrade, which will result in even more excited data in the future, which you can read about here.
The changes between DR7 and DR8 also included changes to the photometric reduction pipeline,
and photometric data in a large area of sky that wasn't previously covered.
The SDSS has an extensive set of tools for you to access its data (all the data releases) including the ability
to search its databases using SQL queries. Queries can be run in TOPCAT,
using the SDSS web interface (short queries) or using a batch job process (longer ones).
The SDSS spectroscopic survey measures spectra using optical fibers with an aperture of about 3 arcseconds.
For nearby galaxies, this means that it can measure the stellar velocity disperion of the central regions
(within 3 arcsec)
In this example, let's find all the most massive galaxies, as indicated by their central velocity dispersion,
within a small (carefully chosen) area of the sky and recessional velocity range.
Because we are most interested in using the spectroscopic dataset, we are going
to use the DR7 tools. Go to the
DR7 SQL search tool
and enter the following query command. Be sure you follow its logic.
SELECT
  p.ra, p.dec, s.z, p.expAB_r, p.petroMag_g,p.petroMag_r,
  p.lnLExp_r, p.lnLDeV_r, l.sigma, l.sigmaErr,
  l.ew, l.ewErr
FROM PhotoObj p, SpecObj s, SpecLine l
WHERE
  p.SpecObjID = s.SpecObjID AND
  p.SpecObjID = l.specobjID AND
  s.eClass < 0 AND
  p.fracDev_r > 0.8 AND
  l.lineID = dbo.fSpecLineNames('H_3970') AND
  l.sigma*300000.0/l.wave > 500 AND
  (p.ra >= 194 AND p.ra <= 196) AND
  p.dec >= 27 AND p.dec <=29 AND
  s.z >= 0.02 AND s.z <= 0.03
order by p.ra
Notice that the velocity dispersion parameter sigma is expressed in weird units. To convert to km/s you multiply by c and
divide by the rest wavelength. See the expression above. Also, notice that we have searched
only a very small area of the sky and for an extreme set of object; if you run a wider area search, you'll need to
use the batch job server! Also, we strongly advise that the
first time you try a query you should select "Check syntax only" and hit "submit". It should tell you that
your SQL syntax was ok; it will, in this case.
Since the above query is just intended to
demonstrate the process, leave the output at HTML. Hit submit and wait until the query is returned.
How many objects do you find?
Let's take a look at those objects in various extragalactic databases:
125903.9+280725 194.7663 28.1236
DR7Navigate
DR8Navigate
DSS2red.03
DSS2blu.03
NED1.0 (search NED within 1')
125929.4+275100 194.8725 27.8500
DR7Navigate
DR8Navigate
DSS2red.03
DSS2blu.03
NED1.0 (search NED within 1')
130157.6+280021 195.4900 28.0058
DR7Navigate
DR8Navigate
DSS2red.03
DSS2blu.03
NED1.0 (search NED within 1')
What can you say about them based on their images? They are all pretty near each other on the sky; why is this field interesting?
How do the objects above compare to the objects below? Try to make some generalized comments on their photometric and spectral properties.
125902.1+280656 194.7588 28.1156
DR7Navigate
DR8Navigate
DSS2red.03
DSS2blu.03
NED1.0
(This is the bluer object SW of the 1st one above.)
130037.8+280329 195.1575 28.0581
DR7Navigate
DR8Navigate
DSS2red.03
DSS2blu.03
NED1.0
125757.7+280342 194.4904 28.0618
DR7Navigate
DR8Navigate
DSS2red.03
DSS2blu.03
NED1.0
130006.2+281508 195.0256 28.2522
DR7Navigate
DR8Navigate
DSS2red.03
DSS2blu.03
NED1.0
The above was just intended to show you the power of SQL and how the datasets obtained by the SDSS can be used to
give valuable insight into the stellar populations and star formation histories of galaxies. We have already used it to create a few interesting
datasets for you to learn more about galaxy populations from wide area surveys.
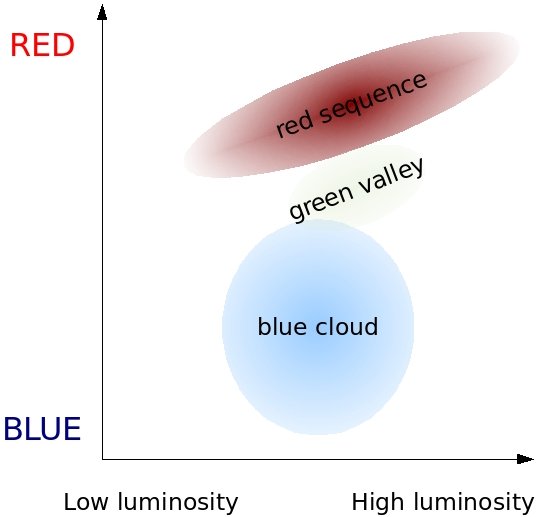
Comparing optically selected and HI selected populations via the color-magnitude diagram (CMD)
Analogous to the Hertsprung-Russel (HR) diagram used to characterize the nature and evolutionary state of stars, the SDSS photometric database can
be used to construct a color-magnitude diagram for galaxies. Based on SDSS, authors such as
Baldry et al. (2004) have separated the SDSS population into the "red sequence" and the "blue cloud", with a smaller number of objects in
the intermediate "green valley".
Here is a figure from the Baldry et al. (2004) paper on the left and two cartoon illustrations describing possible evolutionary paths to the
right (click to enlarge):
Notice that sometimes the horizontal axis is presented in different ways; the choice here is deliberate to illustrate the confusion.
Does optical luminosity directly translate into stellar mass? What assumptions do you need to make?
Here are the optical luminosities and optical colors of two sets of galaxies which are contained within the **exact** same sky
area and velocity range (i.e., they are similarly "volume-limited"). Note that we have "massaged" these data for you
(we have calculated distances using a model of the local universe velocity field and have corrected the
magnitudes for Galactic and internal extinction and for redshift). Download the CSV files for the two samples:
Use TOPCAT to construct the CMD of each. Set the axis limits to
be x=(-24.,-15.) and y=(-0.5,3.5); any large sample will always contain some outliers most of which
are probably bogus data points, so we toss them out here. Can you make a plot superposing the two on the same graph?
What do you conclude?
While you are at it, we suggest you compare the distribution of the galaxy distances in each sample; make histograms.
What does the difference between the two samples tell us?
Interpreting the full multiwavelength spectral energy distribution (SED)
We can use the broadband fluxes measured by different surveys to measure the spectral energy distribution or SED.
We can then compare the observed SED to that expected from models of the origin of emission at different wavelengths
(or frequencies) to figure out what gives rise to
the photons we detect. Again, as a very simple example (which we have overtrivialized significantly), let's plot the
SED of two "mystery" objects using the files below; then we'll look to see
what they actually are. As in Sudoku or a crossword puzzle, no looking at the answers until after you make the plots
and discuss the observed SEDs. Download the two CSV files which give frequency, flux at that frequency, and a
filter/band indicator for the
two objects.
In both cases, the flux values at various wavelength bands have been compiled from public datasets; in reality,
what you've got is a subset of the photometric values listed for each object at the NED,
and the available measurements for the two sources don't always overlap.
Notice that each file contains a third column with a somewhat crytpic
alphanumeric code which is supposed to indicate the wavelength/frequency range
of the measurement. The first column always contains a frequency even when the code indicates a
wavelenght: 500 nm = 5000 Angstroms = 0.5 micron ~ 6.E+04 GHz (you can find converters on the web).
Use TOPCAT to construct the SED of each (though maybe you want to overplot them?); be sure to set the axes
to display log quantities. We suggest that you set the axes to be: x-axis=(1e07,1e19) and y-axis=(1e-06,1e05).
What differences do you notice? How might you explain them?
And when you're really done and you want to see what the mystery objects are, look here.
We hope we have demonstrated that wide area surveys open doors to the exploration of galaxies in many different ways.