Exploring Early Galaxies with the CCAT
Activity: WIDE AREA GALAXY SURVEYS
The wide area capability of CCAT will make it especially useful to conduct deep, large
area surveys of the submillimeter sky. In this activity, we will explore a few datasets
gleaned from existing large area surveys at optical and radio wavelengths to explore
in general terms how surveys of large numbers of galaxies can be used to learn about
their formation and evolutionary history.
Find this activity at:
http://www.astro.cornell.edu/specialprograms/reu2012/workshops/ccat12_1.htm
Interpreting the full multiwavelength spectral energy distribution (SED)
We can use the broadband fluxes measured by different surveys to measure the spectral energy distribution or SED.
We can then compare the observed SED to that expected from models of the origin of emission at different wavelengths
(or frequencies) to figure out what gives rise to
the photons we detect. Again, as a very simple example (which we have overtrivialized significantly), let's plot the
SED of two "mystery" objects using the files below; then we'll look to see
what they actually are. As in Sudoku or a crossword puzzle, no looking at the answers until after you make the plots
and discuss the observed SEDs. Download the two CSV files which give frequency, flux at that frequency, and a
filter/band indicator for the
two objects.
In both cases, the flux values at various wavelength bands have been compiled from public datasets; in reality,
what you've got is a subset of the photometric values listed for each object at the NED,
and the available measurements for the two sources don't always overlap.
Notice that each file contains a third column with a somewhat crytpic
alphanumeric code which is supposed to indicate the wavelength/frequency range
of the measurement. The first column always contains a frequency even when the code indicates a
wavelenght: 500 nm = 5000 Angstroms = 0.5 micron ~ 6.E+04 GHz (you can find converters on the web).
Use TOPCAT to construct the SED of each (though maybe you want to overplot them?); be sure to set the axes
to display log quantities. We suggest that you set the axes to be: x-axis=(1e07,1e19) and y-axis=(1e-06,1e05).
What differences do you notice? How might you explain them?
And when you're really done and you want to see what the mystery objects are, follow the links below:
Do the differences in the SED of the two objects make sense to you now that you know what they are?
We hope we have demonstrated that wide area surveys open doors to the exploration of galaxies in many different ways.
 APOD110828
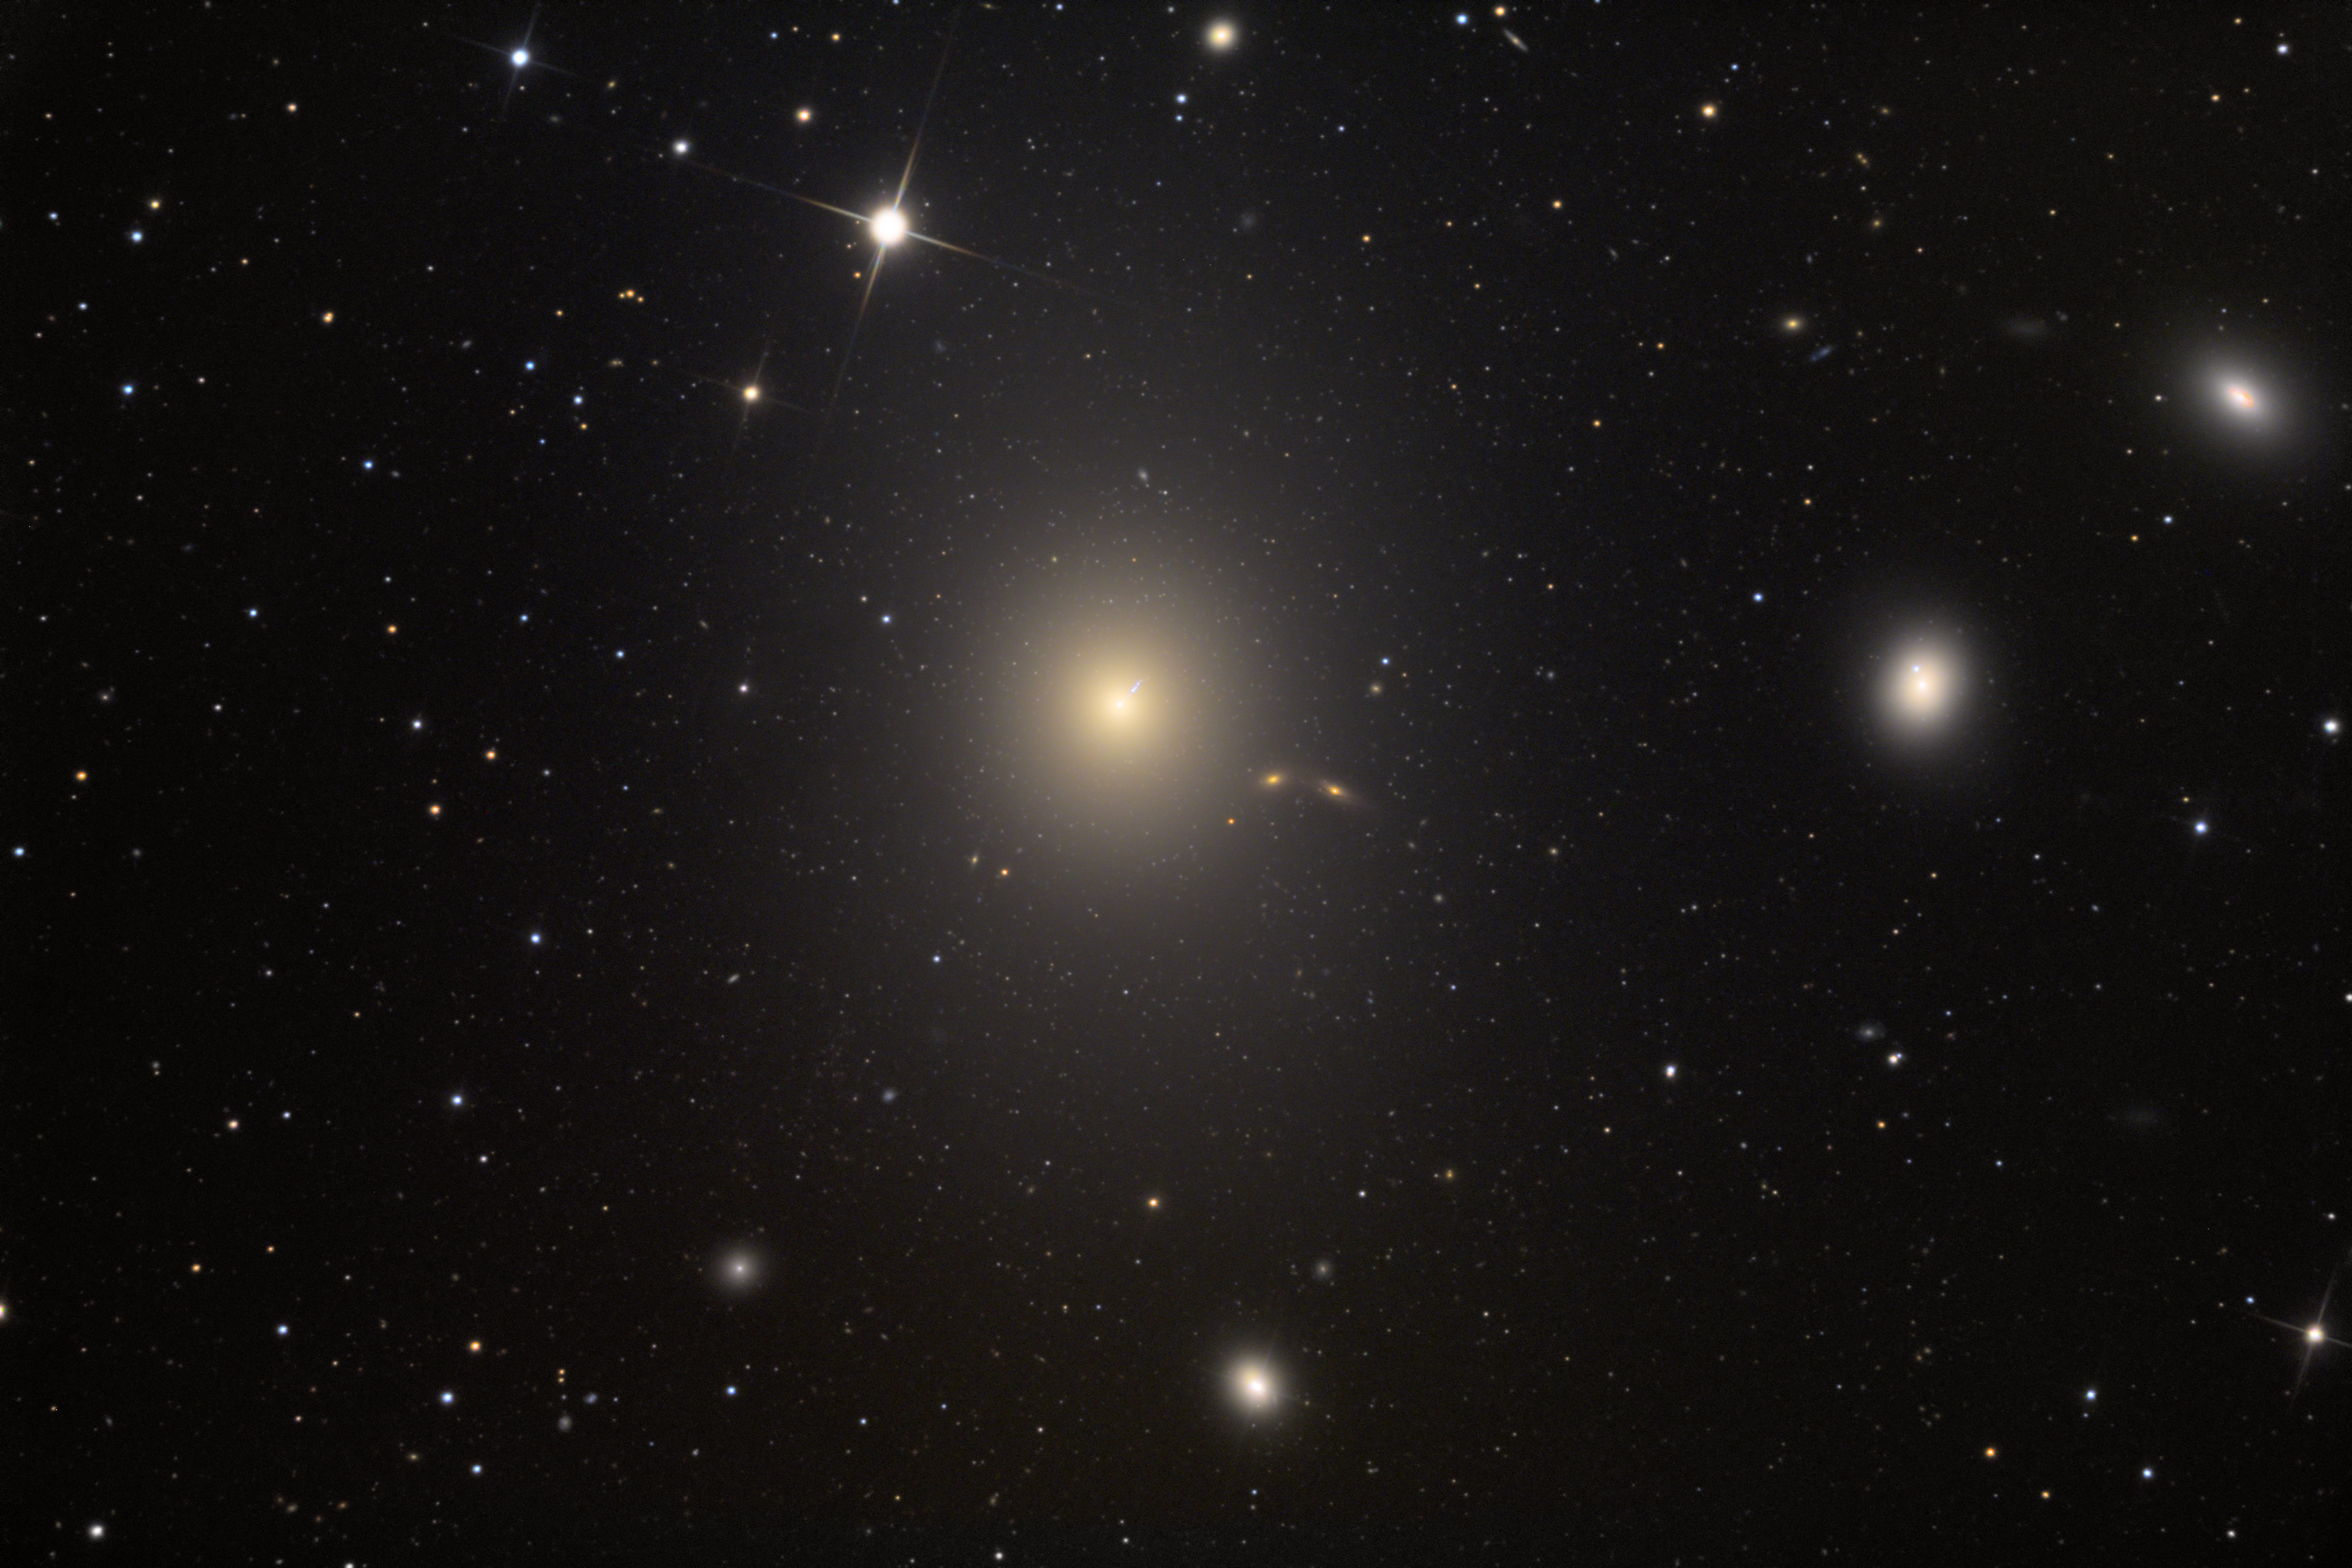 APOD100520
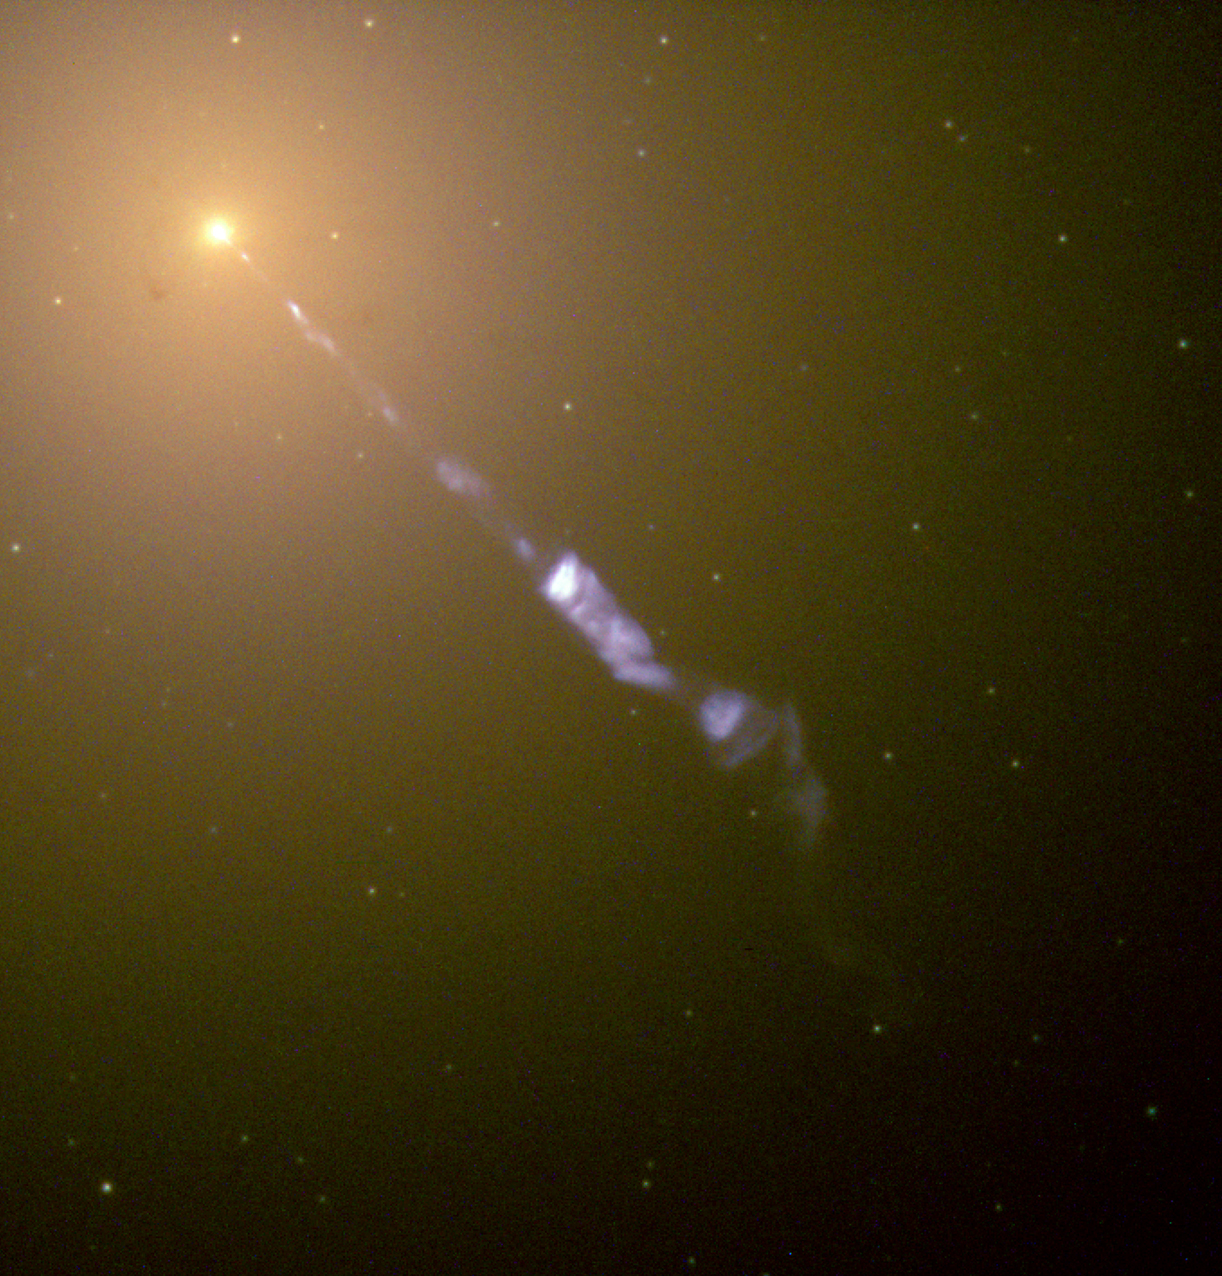
 APOD990216
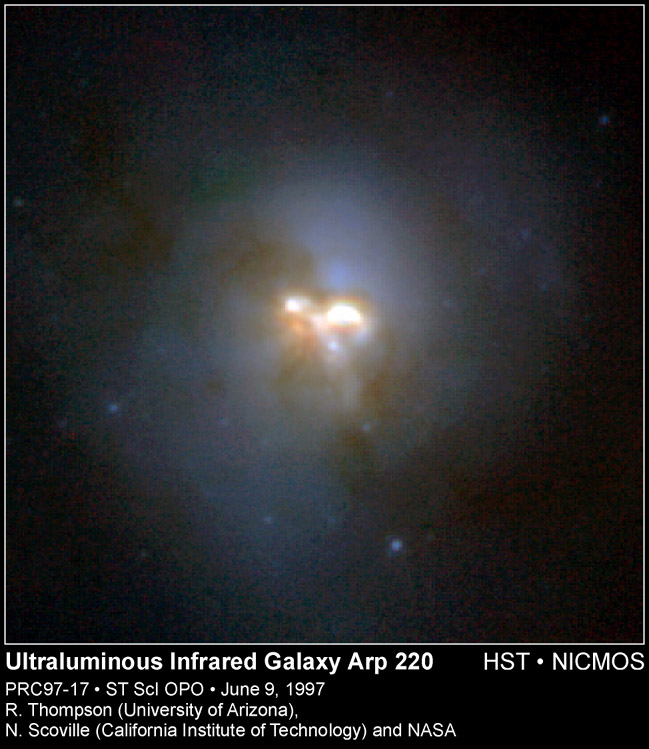 APOD970617
 Spitzer GOALS