| File | # objects | Description |
|---|---|---|
| File | 13347 | Position and redshift data for all galaxies in a "slice" from RA,Dec = (7.5-16.5) and (5.86-12.15), Vhelio < 18200 from AGC |
| File | 813 | Position and redshift data for all galaxies in AGC database in region |
| File | 731 | Photometric and spectroscopic data for objects in the SDSS DR7 photometric and spectroscopic databases |
| File | 262 | ALFALFA HI data for objects in same region |
| File | 213 | Photometric and spectroscopic data for objects in the ALFALFA dataset and also in the SDSS DR7 spectroscopic database |
| File | 48 | Photometric data for objects in the ALFALFA dataset but not in the SDSS DR7 spectroscopic database |
| File | 261 | Photometric and spectroscopic data for objects in the ALFALFA dataset in either SDSS DR7 photometric and/or spectroscopic database; parameters set to zero where galaxy is not in the spectroscopic database. |
| File | 727 | Line dispersions and equivalent width data for objects SDSS DR7 spectroscopic database |
| File | 212 | Line dispersions and equivalent width data for objects SDSS DR7 spectroscopic and ALFALFA databases |
| File | 212 | Line dispersions and equivalent width data for objects SDSS DR7 spectroscopic and ALFALFA databases |
| File | 212 | Line dispersions and equivalent width data for objects SDSS DR7 spectroscopic and ALFALFA databases |
| File | 727 | File containing corrected magnitudes/colors, absolute magnitudes, inclinations, stellar masses |
| File | 261 | Same as above for ALFALFA catalog sources only |
| File | 728 | File containing many derived properties for DR7 spectroscopic sample I make a correction for stellar absorption and an aperture correction in calculating the SFR (See notes) |
| File | 258 | File containing many derived properties, as above, but also the HI and dynamical masses, for ALFALFA sources |
| File | Description |
|---|---|
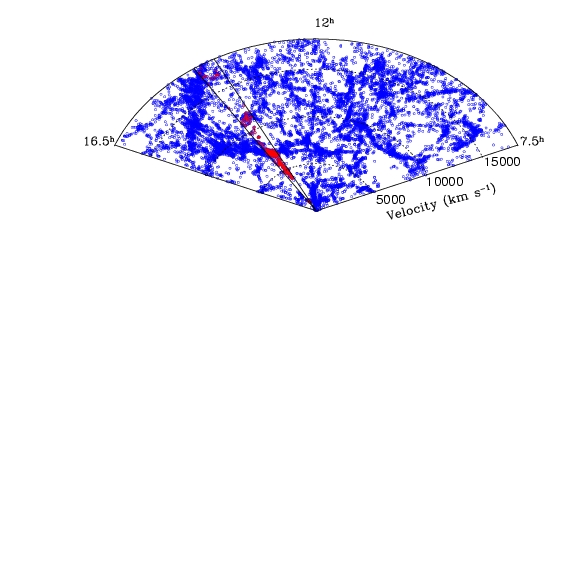
| cone_slice.jpg | Cone diagram, full velocity range, all RA's, 6 deg in Decl. |
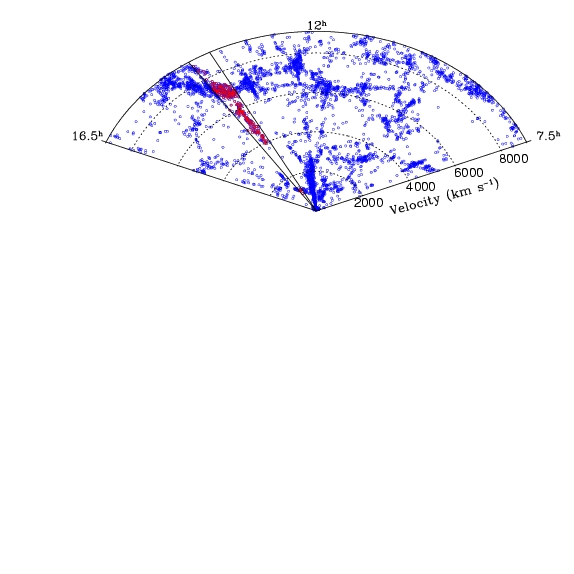
| cone_slice.jpg | Cone diagram, V < 9100 km/s, all RA's, 6 deg in Decl. |
| zw6deg_make1s.jpg | Velocity versus radial distance from center, 6 degree radial region |
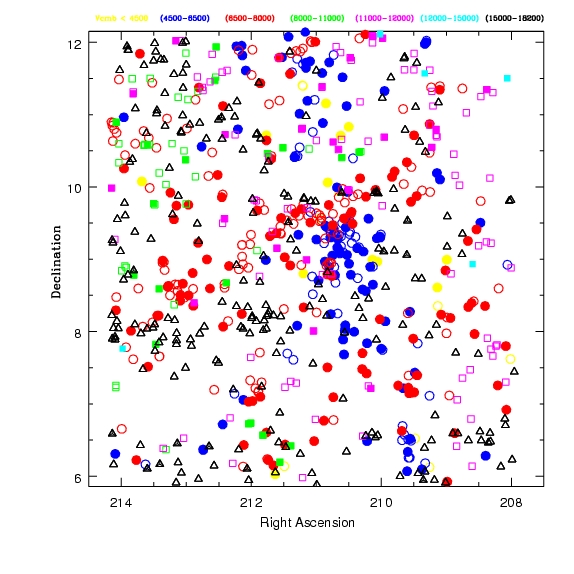
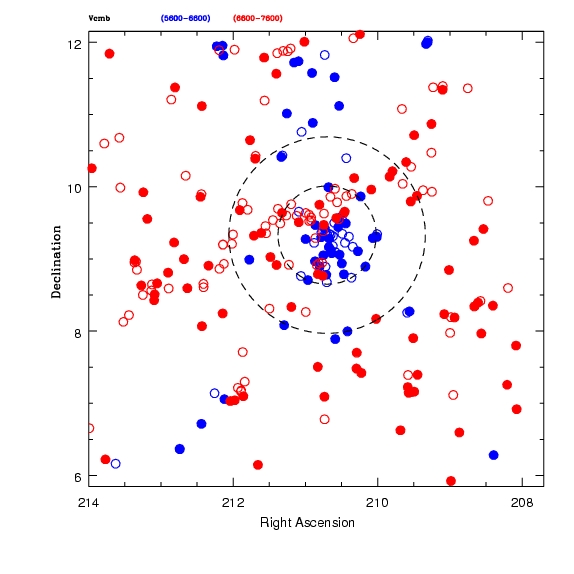
| skyplotcolor.jpg | RA,Decl plot for galaxies, color coded by velocity range |
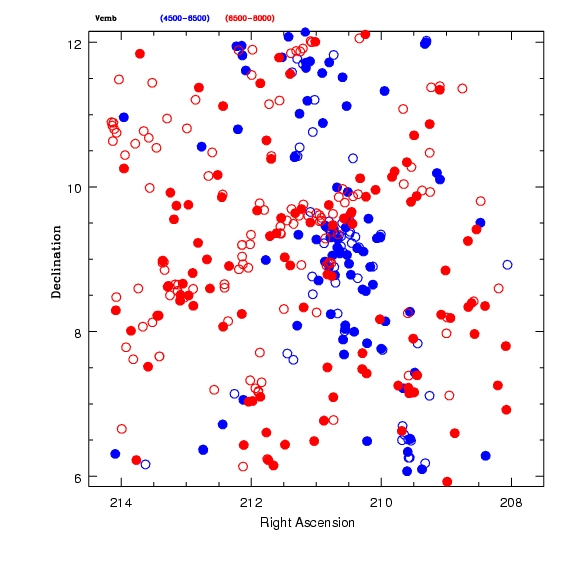
| skyplotcolor4500-8000.jpg | RA,Decl plot for galaxies, color coded by velocity range, restricted range |
| skyplotcolor_gps.jpg | RA,Decl plot for galaxies, color coded by velocity range,
restricted range corresponding to MKW12 and the background group Filled symbols identify galaxies also in ALFALFA catalog. The small circle is 0.68 deg; the large one is 1.3 deg. |
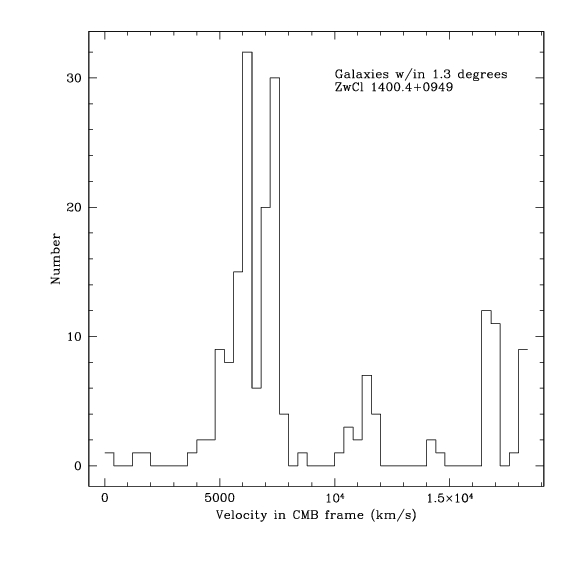
| histo.jpg | Histogram for all galaxies within 1.3 degrees of center |
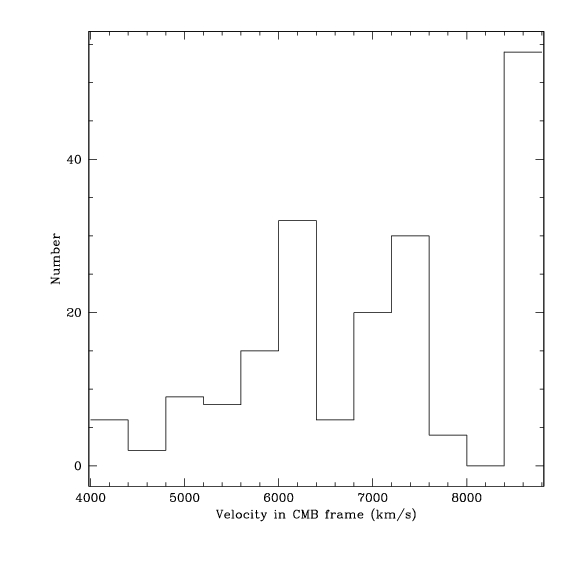
| histo2.jpg | Histogram only from 4000 to 8800 |
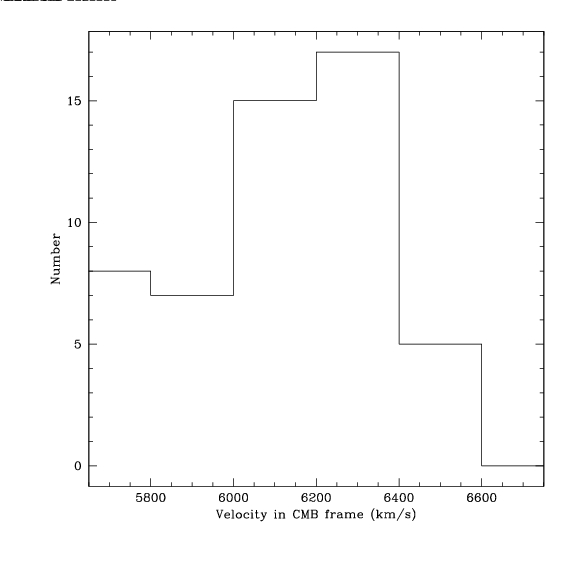
| histo3.jpg | Histogram only from 5500-6000 |
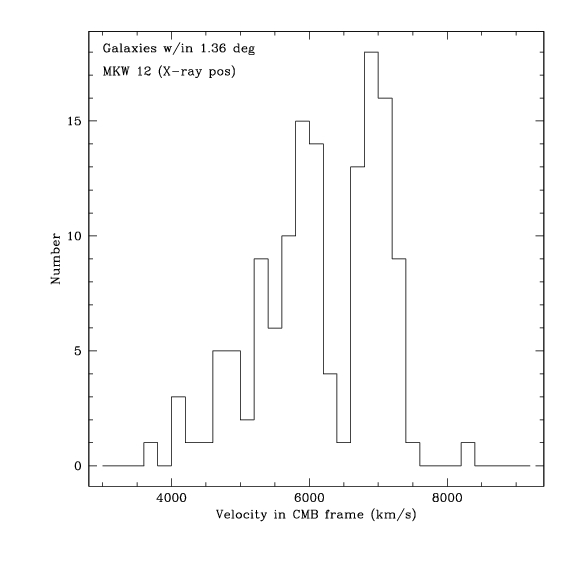
| hist12.jpg | Histogram only from 3000-9000, R < 1.36 deg |
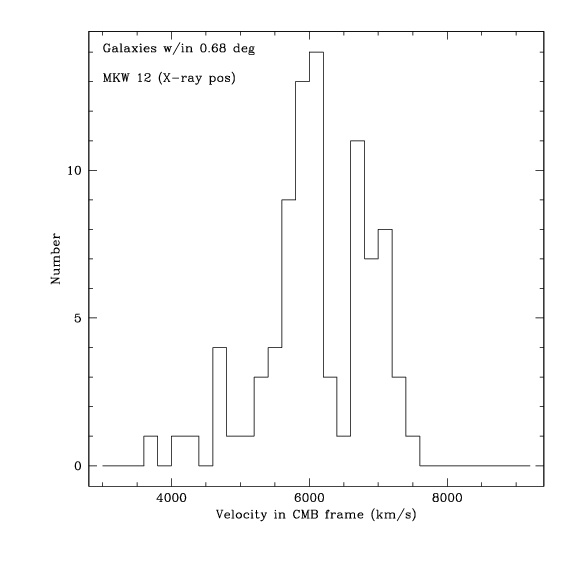
| hist13.jpg | Histogram only from 3000-9000, R < 0.68 deg |
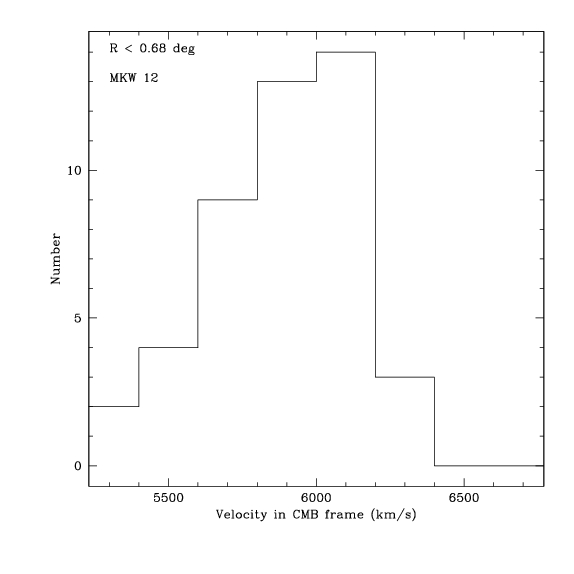
| histmkw12.0.68deg.jpg | Histogram only from 5600-6600, R < 0.68 deg; this is the main MKW12/WBL486 group The fit for 45 galaxies is: Vmean = 5861, sigma = 241 km/s |
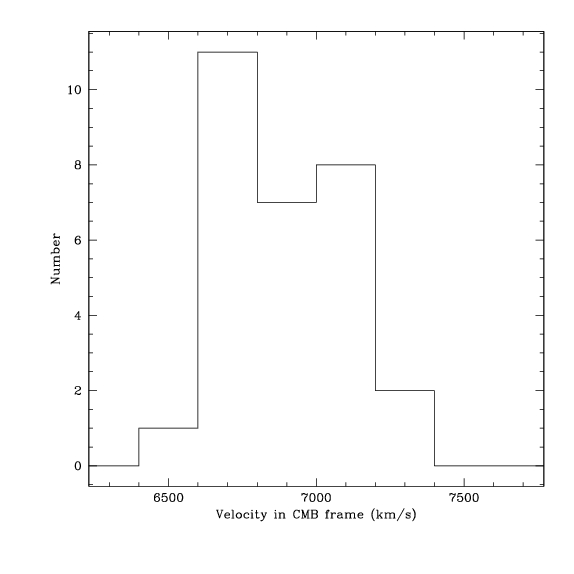
| histbackgp.0.68deg.jpg | Histogram only from 6600-7600, R < 0.68 deg; this is the background group The fit for 29 galaxies is: Vmean = 6890, sigma = 201 km/s |
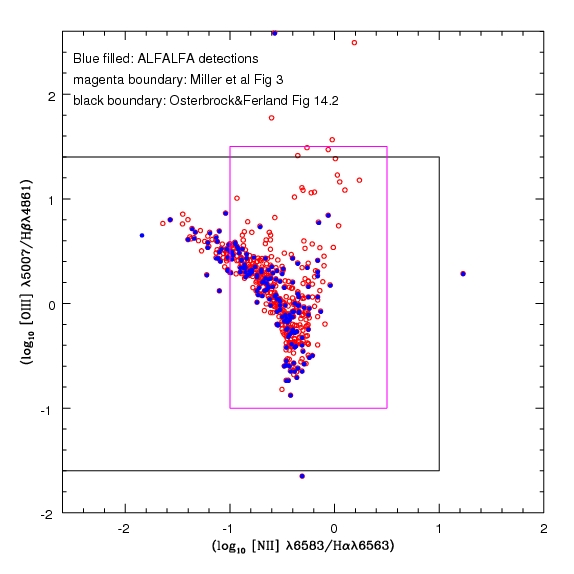
| lineratios.jpg | BPT/Osterbrock diagram for the sample. Filled symbols identify galaxies in ALFALFA catalog. |
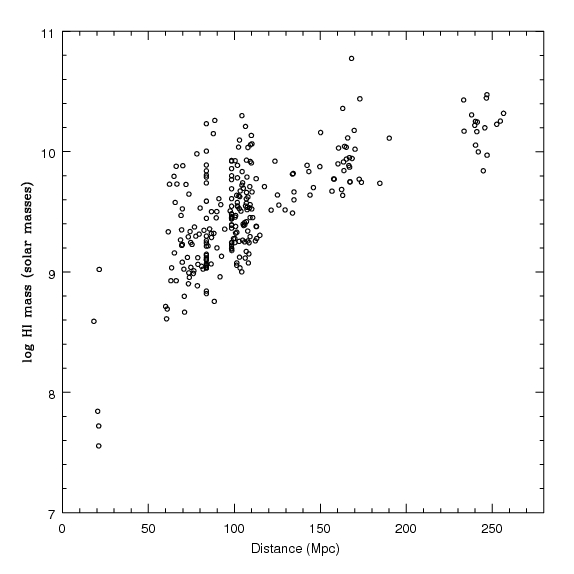
| himass_spanh.jpg | Spanhauer diagram of HI mass versus distance. |
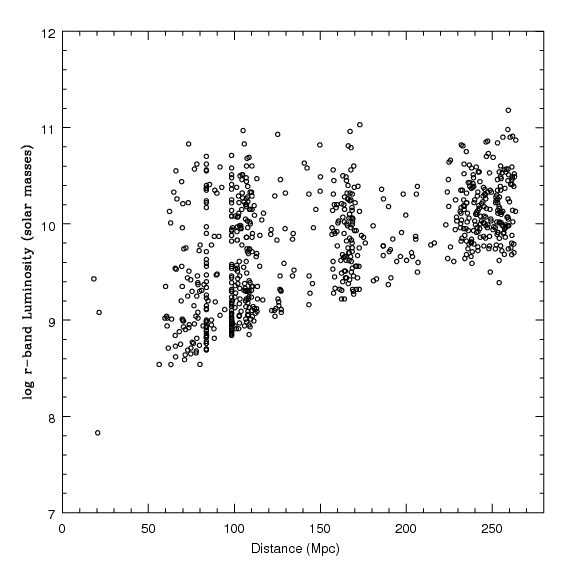
| lum_spanh.jpg | Spanhauer diagram of r-band luminosity versus distance. |
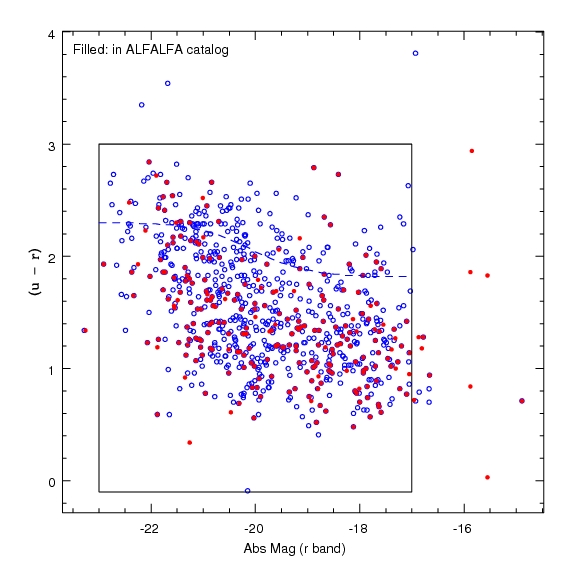
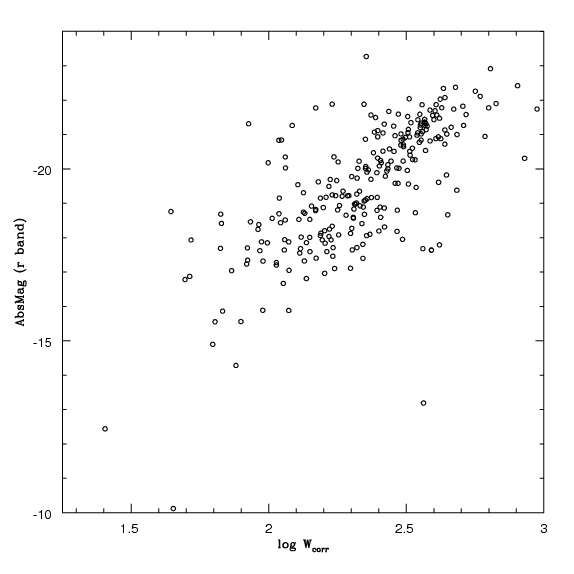
| baldryplot.jpg | Color-magnitude diagram, using corrected colors and magnitudes, with the Baldry et al. divider superposed. In this newer version, filled symbols identify the ALFALFA detections. |
| tfplot.jpg | Tully-Fisher diagram for the ALFALFA catalog sample. |
| hizb1.jpg | Same as above but with color coding by morphological type, and the big filled cirecles identify galaxies which are members of ZwCl400.4+0949=MKW 12 |
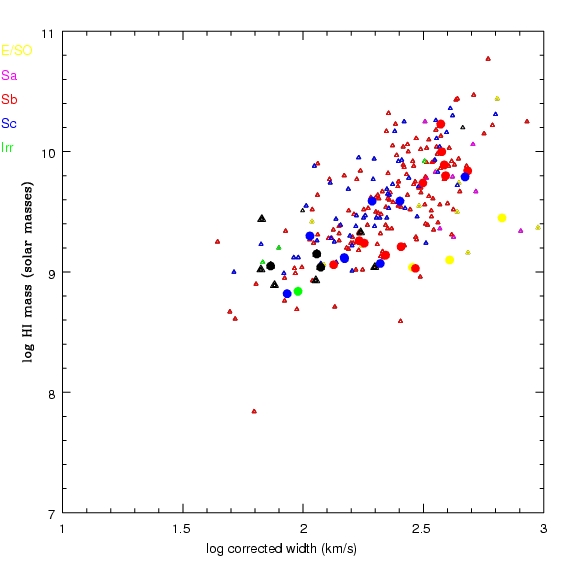
| hizmorphb.gif | Log linear diam versus log HI mass for ALFALFA catalog sample; different colors denote different morphological types. Large filled circles identify galaxies which are members of ZwCl400.4+0949=MKW 12. |
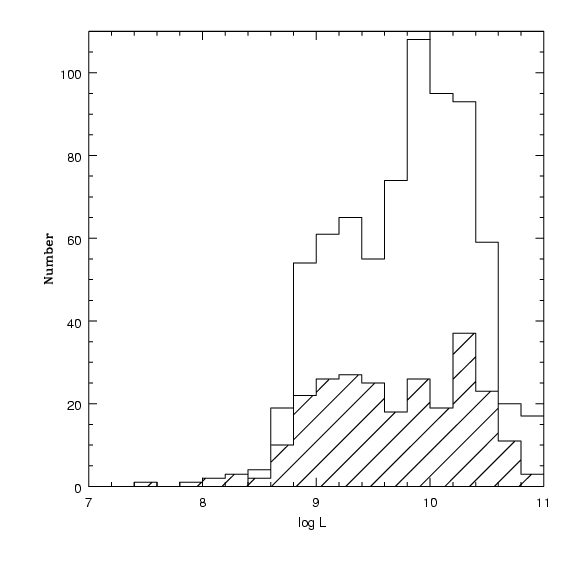
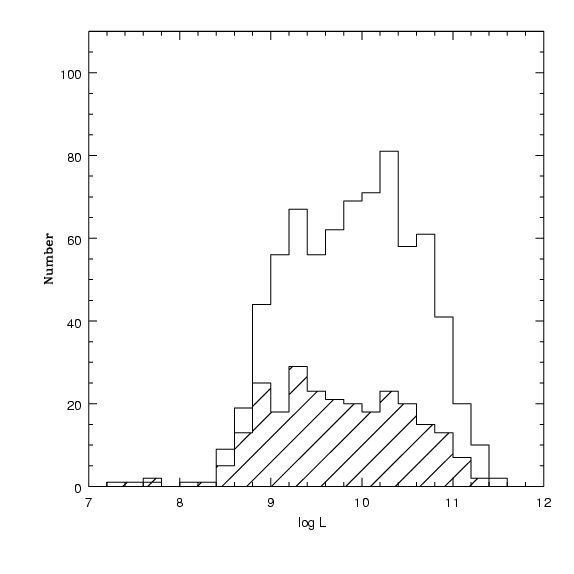
| histlogL.jpg | Histogram of Log L(rband). The shaded portion shows galaxies in the ALFALFA subsample |
| histlogMstar.jpg | Histogram of Log stellar mass. The shaded portion shows galaxies in the ALFALFA subsample |
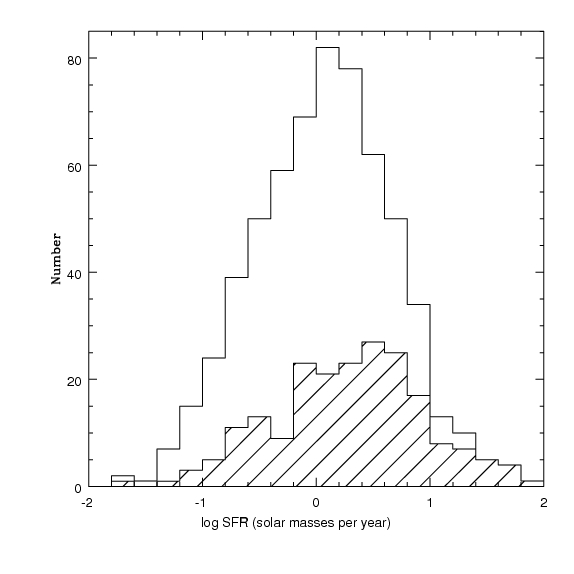
| histlogSFR.jpg | Histogram of Log SFR. The shaded portion shows galaxies in the ALFALFA subsample |
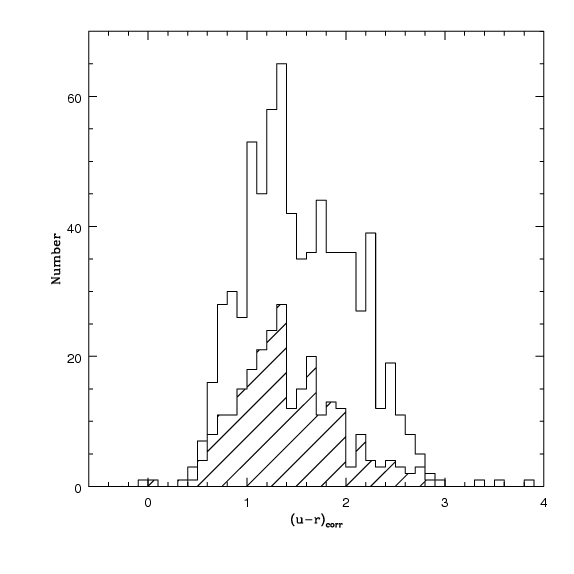
| histcolor.jpg | Histogram of (u-r)corr. The shaded portion shows galaxies in the ALFALFA subsample |
| alfalfa_notdr7_1.gif alfalfa_notdr7_2.gif alfalfa_notdr7_3.gif |
SDSS mosaic images of the galaxies detected by ALFALFA not in the SDSS spectroscopic sample |
| baldryoutliers.gif | SDSS mosaic images of the galaxies which are outliers in the Baldry et al. color-magnitude diagram |
| ADS link | Description |
|---|---|
| Gregory & Thompson 1978 ApJ 222, 784 | The Coma/A1367 supercluster and its environs, including ZW1400.4+0949 |
| Haynes & Giovanelli 1984 AJ 89,758 | Neutral hydrogen in isolated galaxies. IV - Results for the Arecibo sample, defines the standard of normal HI content |
| Giovanelli et al 2005 AJ 130, 2598 | The Arecibo Legacy Fast ALFA Survey. I. Science Goals, Survey Design, and Strategy, describing the ALFALFA survey strategy |
| Giovanelli et al 2007 AJ 133, 2569 | The Arecibo Legacy Fast ALFA Survey. III. H I Source Catalog of the Northern Virgo Cluster Region, first catalog of ALFALFA data including a few galaxies in the Zw1400 region |
| Baldry et al 2004 astro-ph/0410603 | Color bimodality: Implications for galaxy evolution, a conference proceedings paper reviewing SDSS results |
| Baldry et al 2004 ApJ 600, 681 | Quantifying the Bimodal Color-Magnitude Distribution of Galaxies, the longer paper on which the one above is based |
| Miller et al 2003 ApJ 597, 142 | The Environment of Active Galactic Nuclei in the Sloan Digital Sky Survey, analyzing the observed AGN fraction of AGN as a function of environment based on early SDSS results |
| Hopkins et al 2003 ApJ 599, 971 | Star Formation Rate Indicators in the Sloan Digital Sky Survey, describing methods of deriving the SFR from available SDSS data |
| Kewley et al 2006 MNRAS 372, 961 | The host galaxies and classification of active galactic nuclei, more discussion of SDSS spectroscopic diagnostics |
| Girardi et al. 2002 ApJ 569, 720 | Observational Mass-to-Light Ratio of Galaxy Systems from Poor Groups to Rich Clusters including MKW 12 |
| Koranyi & Geller 2002 AJ 123, 100 | Kinematics of AWM and MKW Poor Clusters including MKW 12 |
| Schlegel, Finkbeiner & Davis 1998 ApJ 500, 525 | Maps of Dust Infrared Emission for Use in Estimation of Reddening and Cosmic Microwave Background Radiation Foregrounds, including conversions to calculate extinctions in different wavelength/filter bands. |
| Blanton et al. 2003 AJ 125, 2348 | Estimating Fixed-Frame Galaxy Magnitudes in the Sloan Digital Sky Survey, which actually suggests that maybe we should apply no correction since our objects are so nearby. |
| Giovanelli et al 1995 AJ 110, 1059 | Dependence on Luminosity of Photometric Properties of Disk Galaxies: Surface Brightness, Size, and Internal Extinction giving internal extinction correction, according to axial ratio and luminosity, for I-band |
| Fukugita, Shimasaku, & Ichikawa, T. 1995 PASP 107, 945 | Galaxy Colors in Various Photometric Band Systems, including conversion relations for different filter systems |
| Bell et al 2003 ApJS 149, 289 | The Optical and Near-Infrared Properties of Galaxies. I. Luminosity and Stellar Mass Functions, including appendix with relationship between M/L ratios and stellar masses. See also the ALFALFA U-grad page |
SELECT
 p.ra, p.dec,s.z,s.zerr,p.petroR90_r,p.petroR50_r,p.expAB_r,
 p.petroMag_u,p.petroMag_g,p.petroMag_r,p.petroMag_i,p.petroMag_z,
 p.fiberMag_r,
 p.lnLExp_r, p.lnLDeV_r, p.isoA_r, p.isoPhi_r, l.sigma, l.sigmaErr,
  l.ew, l.ewErr, l.continuum, l.chisq, l.nu, s.zWarning,p.objID
FROM PhotoObj p, SpecObj s, SpecLine l
WHERE
 p.SpecObjID = s.SpecObjID AND
 p.SpecObjID = l.specobjID AND
 s.specClass=2 AND
 l.lineID = dbo.fSpecLineNames('Ha_6565') AND
 p.ra >=207.95 AND p.ra <= 214.15 AND
 p.dec >= 5.86 AND p.dec <=12.15 AND
 s.z <= 0.061
order by p.ra
It is sometimes useful to run a query using CasJobs.