
The NSF-sponsored
Undergraduate ALFALFA Team program promotes
undergraduate research within the ALFALFA
project.
The ZwCl1400.4+0949 Summer 2011 Page
This page is designed to lead us through some of the basic analysis that we should try to
accomplish for each group of galaxies. We use as an example the poor cluster/rich group known
as Zw1400.4+0949 also known as MKW 12.
Getting started: analyze the group structure and determine its mass
We need to define group membership and anlysis the properties of the group. So here are some things to do:
- We can use the AGC to examine the distribution of galaxies on the sky and in redshift. So learn about
using the AGC.
- Learn how to use the LOVEDATA utilities AGCBROWSE and PLOTALFA.
- Use NED to find other names for ZwCl1400.4+0949.
- We have to decide on the central position and redshift distribution of ZwCl1400.4+0949.
Look up information about it in:
Koranyi & Geller 2002 AJ 123, 100
Price et al. 1991 AJ 123, 10
Aileen: would you hunt around for more recent X-ray info? Can you look up the ROSAT reference too?
The answer: Let's adopt the center to be RA = 14h02m48s = +09d19'40" = (210.70,9.33).
- Most galaxy redshifts given in the literature/AGC/NED are quoted in the heliocentric rest frame. We need
to correct for the motion of the Milky Way with respect to the Cosmic Microwave Background. Learn about
the CMB and its dipole. What is the correction we need to apply in the direction of ZwCl1400.4+0949?
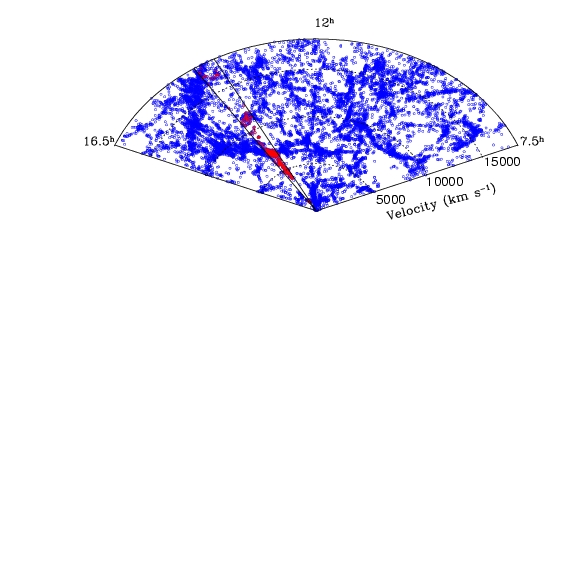
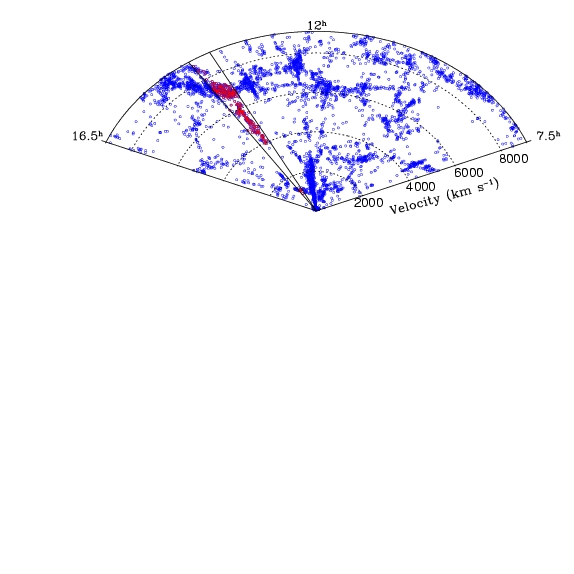
- Here are two interesting "cone diagrams" displaying the redshift distribution of galaxies
in a "slice" from RA,Dec = (7.5-16.5) and (5.86-12.15), Vhelio < 18200 (from the AGC)
Cone diagram, full velocity range, all RA's, 6 deg in Decl.
Cone diagram, zoomed in on the velocity range < 9000 km/s
Try to understand and interpret what you see in these diagrams.
- Here is a plot of the redshift distribution as a function of
radial separation from the center of the group for galaxies within 5 degrees of its center.
What can you infer from this?
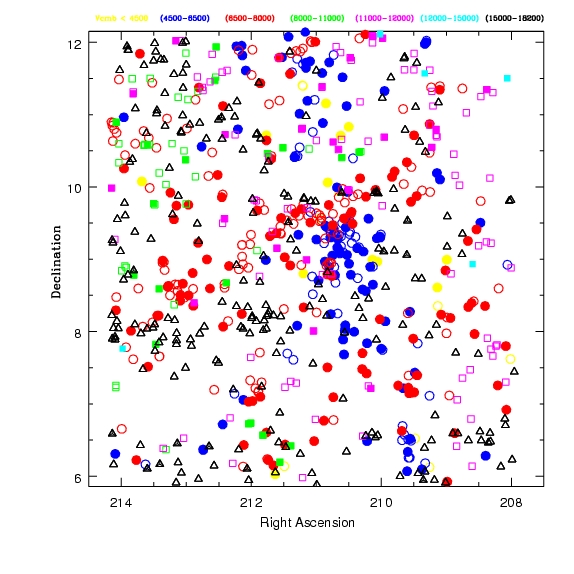
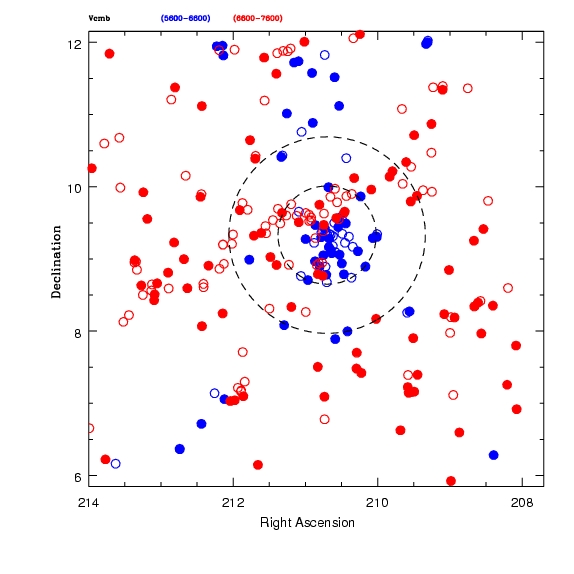
- Let's examine the distribution of galaxies on the sky. Here are three plots:
plot of all galaxies, color coded by redshift
plot of galaxies with redshifts between
4500 and 8000 km/s, color coded by redshift. Filled symbols are galaxies detected by ALFALFA.
The dashed circles trace out radial distances of 1 degree and 2 degrees centered on (210.70,9.33).
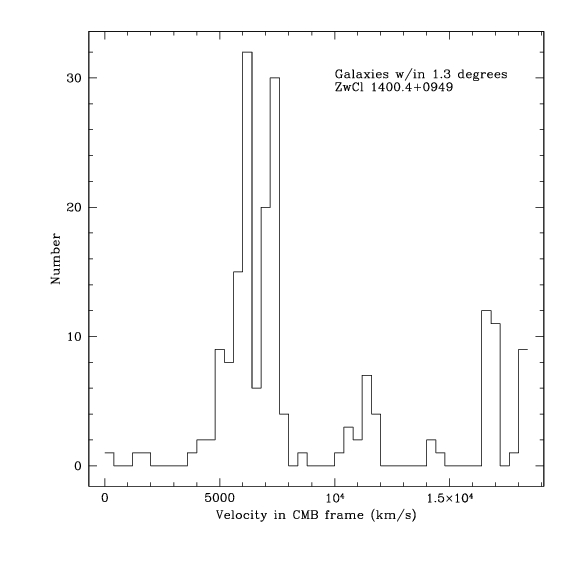
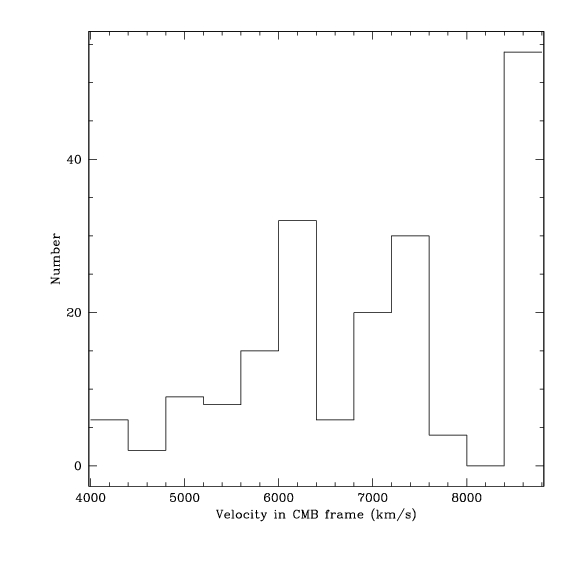
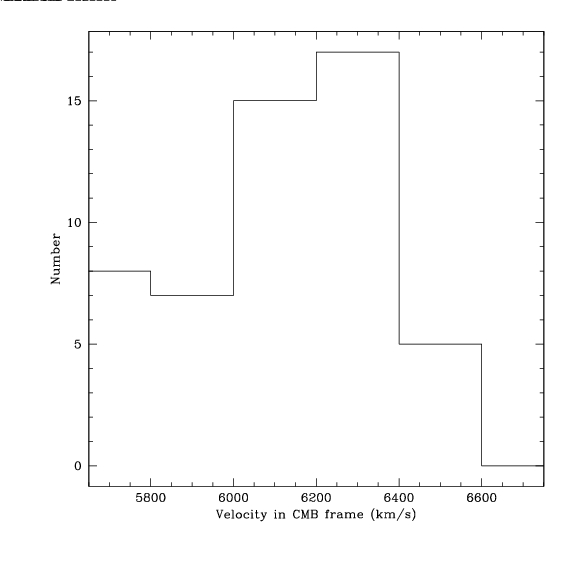
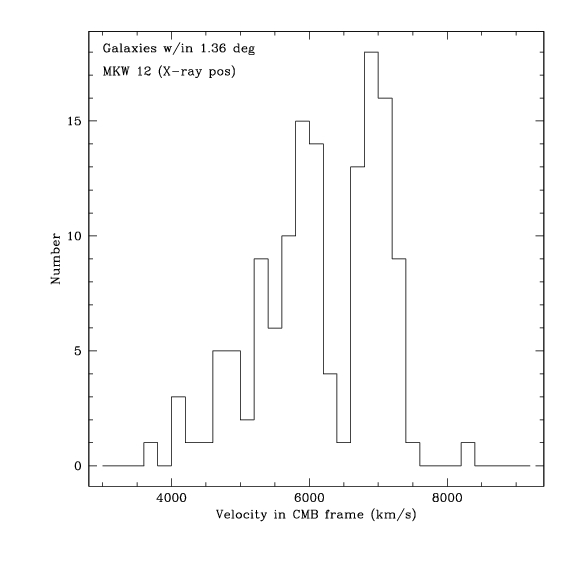
- Now let's look at the distribution in redshift by examining some histograms.
histogram for all galaxies within 1.3 degrees of center
histogram only from 4000 to 8800 km/s
histogram only from 5500-6000 km/s
histogram only from 3000-9000 km/s, R < 1.36 deg
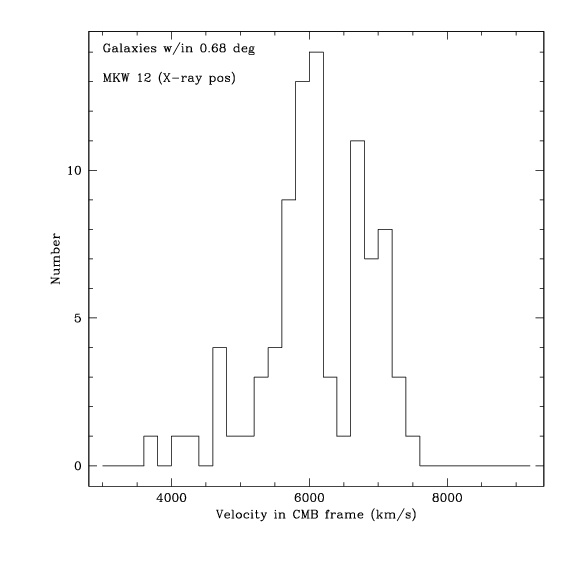
histogram only from 3000-9000 km/s, R < 0.68 deg
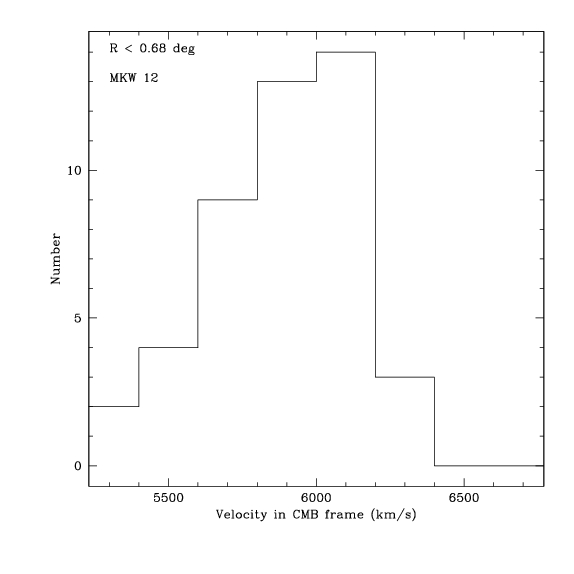
histogram only from 5600-6600 km/s,
R < 0.68 deg; this is the main MKW12/WBL486 group. The fit for 45 galaxies is: Vmean = 5861, sigma = 241 km/s
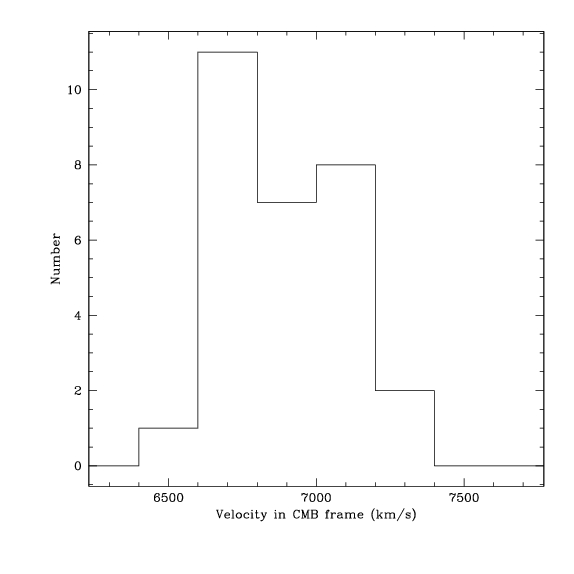
histogram only from 6600-7600 km/s,
R < 0.68 deg; this is the background group. The fit for 29 galaxies is: Vmean = 6890, sigma = 201 km/s
- Advanced Reading:
Dressler & Shectman 1988
AJ 95, 985 Test for substructure in clusters from radial velocity measurements
Heisler, Tremaine and Bahcall 1985
ApJ 298, 8 The projected mass estimator.
Ashman, Bird & Zepf 1994
AJ 108, 2348 Statistical tests for substructure
- What can we conclude about the structures in the region of Zw1400.4+0949?
Properties of the stellar populations
We need to understand more about the stellar populations, star formation rates etc derived from the SDSS data.
At this time, all the groups we are investigating are covered by SDSS-I through DR7, and I propose that we
stick to that. As we all appreciate, legacy survey data, be it from SDSS or ALFALFA, have to be understood
and real data always is uglier than ideal data. So, we need to pay attention to corrections, limitations,
biases, incompleteness and all that jazz.
A fairly simple approach to calculating stellar masses from SDSS photometry is discussed
on one of the
"Using ALFALFA for Science" pages, specifically the one called
Deriving the stellar mass. That is a first place to start.
At least for the more distant clusters, we may want to use the compilation of derived
properties of DR7 galaxies available from the MPA/JHU folks.
They use more sophisticated methods of SED-fitting (what's that? you ask)
of the photometry to derive stellar masses and re-process the SDSS spectroscopic data to calculate
star formation rates (SFRs). We need to study up more on this.
MORE COMING!!!!!!!!
The UAT Groups Project is coordinated by Martha Haynes.
Last modified: Fri Jun 10 09:31:23 EDT 2011 by martha