Union UAT Workshop June 2015 Group Project
The APPSS survey
3.0 The Arecibo Pisces Perseus Supercluster Survey (APPSS)
3.1 Motivation and design of the survey
The UAT is embarking on a new survey designed to extend the HI mass scaling relations
to lower HI mass. Consider what we need to do to build up our sample of low mass galaxies:
- Why are we biased against lower mass galaxies? Use relevant plots from Activity 1 to illustrate.
- What do we need to do to observe galaxies of lower mass at a given distance?
- We could try to observe much of the sky again to try to find lower mass galaxies, but this
takes a lot of telescope time. Also ALFALFA has shown us that most galaxies with gas also have
stars and star formation. How might we design a survey to target as many lower mass galaxies
as possible, using the scaling relations that have been derived based on ALFALFA and SDSS?
3.2 Exploring the Pisces Perseus Supercluster with the AGC
Download this csv file,
containing data from the Arecibo General Catalog (AGC) (read about the catalog in the link). The file contains data extracted from the vicinity of the Pisces Perseus Supercluster for galaxies that have known velocities in the AGC. Load it into TOPCAT.
Make a sky plot of the data and examine the results.
Make a plane plot of the data, using radeg and decdeg. What do you notice?
Now make a second plane plot of the data, but substitue rawrap for radeg. What does rawrap represent and why is it helpful?
Plots using right ascension should plot east on the left, west on the right. Which of the above plots does this? Fix any that do not.
Do you see any oddities in the distribution of points? Can you explain any inhomogeneities? (Hint: some are intrinsic to the Universe, some are not!)
Make a plot of rawrap versus vhelagc, the heliocentric velocity from the AGC. What does this plot tell you?
Use the TOPCAT subsets tool to restrict the sample to galaxies with declinations greater than 20 degrees. To do
this, select the subsets icon from the Main window (this looks like a purple ellipse containing a red circle). Hit the plus sign in the window that opens to add a subset. Name your sample something like north20, and enter "decdeg > 20.0" in the expression line. Plot this subset as a different color than the main sample in the plots that you made above.
|
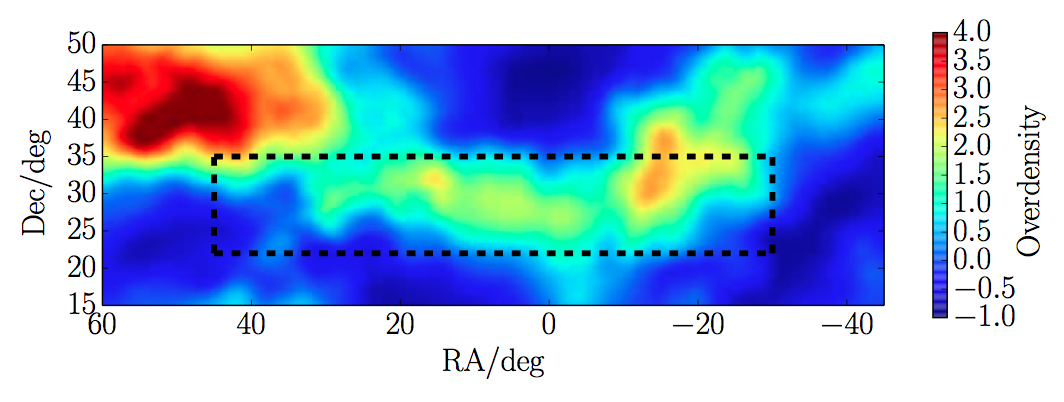
Make a third subset "appsallvel" with declinations between 23 and 35.
Make the plots over again with this subset as a separate color. How does your diagram compare with the
overdensity plot from the 2Mass Redshift survey (2MRS) shown at right? What can you conclude?
|
|
3.3 Querying the SDSS
The UAT Groups Google Site provides an example query that we can use to extract
galaxies from the SDSS site. Your group will be assigned a range in right ascension and declination
to test. Edit the query appropriately and run from TOPCAT, following the directions below
(a nicer summary written by David Craig can be found in our UAT TOPCAT docs page,
under SDSS DR7 TAP Query) :
Use one of the following methods to access the SDSS query. Simple searches can often be done from TOPCAT, but TOPCAT is not kept as up to date in routines or data releases. Select one method to try today, but when you have time, experiment with all three services. It helps to know the different methods in case one or more are down. Note that each option has its "features."
(1) Click on the 'VO' tab in TOPCAT, then the Table Access Protocol (TAP) Query option. In the window that
pops up, type 'sdss' in the Keyword box, then 'Submit Query'. This will return a set of SDSS tables to
search. Select SDSS DR8, then 'Enter Query' at the bottom right. At the bottom, there is an ADQL Text box,
where you can enter your query. ADQL is similar to the SQL search data available straight from SDSS
with a few important differences in syntax and functionality.
(2) Use the SDSS SQL Search, this one linked to DR10. Enter the query in the box, select 'fits' as the save option.
(3) Another option is to use CasJobs
batch query service for longer jobs. You will need an account (free) for CasJobs.
Enter your query in TOPCAT or the SDSS SQL Search. When it returns, load into TOPCAT (if applicable) and
examine the results. To see what kind of galaxies were found, examine some of their SDSS images.
You can do this by
extracting the name, ra, dec from the file in TOPCAT and pasting these into the SDSS List tool. Comment on what you see. What do we need to be aware of when we use data from SDSS?
Another way to look at images is to set TOPCAT to display the SDSS image of a region around a given RA and Dec. To do this, click on your table in the main TOPCAT window, then click on the box next to 'Activation Action', which will say '(no action)' if not already activated. In the window that pops up, click 'Display Cutout Image', then select SDSS Colour Images' from the pulldown menu next to Cutout Service. Then click OK. Open a window showing your table and click on a galaxy. The image from SDSS should appear.
This should also work from your sky plot - click on a point to see the galaxy.
Match your SDSS targets with the ALFALFA HI catalog. Were any of the targets found by ALFALFA? What do these targets look like?
Plot your targets on the sky plots you made for the Pisces Perseus supercluster and comment on their
locations.
4.0 Other Activities (as time allows)
Try to identify the clusters/groups of galaxies in the Pisces Perseus Supercluster
data.
Check out the GalaxyZoo and Color Magnitude Diagram Activity
Last modified: Sun Jun 28 14:00:52 EDT 2015
by becky