Credit: SDSS
| R.A.(J2000) | |
| Dec.(J2000) | |
| Recessional velocity in heliocentric rest frame | |
| Recessional velocity in CMB rest frame | |
| Distance to the cluster (quoted in NED) | |
| Galactic latitude | |
| Galactic extinction in g-band | |
| Galactic extinction in i-band |
|
A common way to explore the properties of a population of galaxies involves constructing
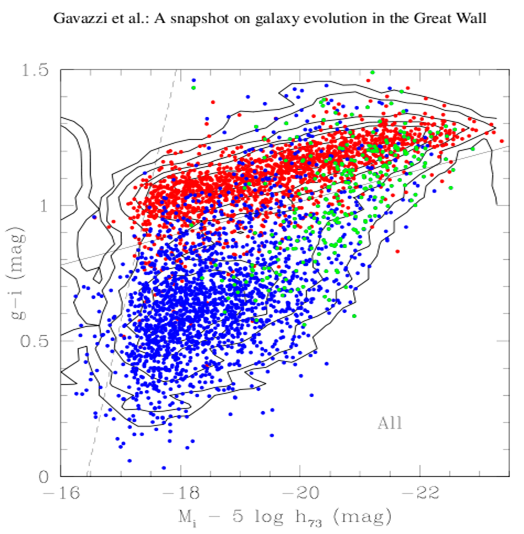
its color-magnitude diagram (CMD). A nice example which we will use for reference
is the work of ALFALFA team member Peppo
Gavazzi and his co-workers who constructed the CMD of a large sample of galaxies within
420 square degrees of sky covering
the Coma supercluster and its member groups and clusters of galaxies as presented
in
Gavazzi+ (2010), A&A 517, 73 and shown here to the right. Taken from Fig. 3 of
that paper, the figure shows the "g-i color versus i-band absolute magnitude
relation of all galaxies in the C[oma]S[upercluster] coded according to Hubble type: red = early-
type galaxies (dE-E-S0-S0a); blue = disk galaxies (Sbc-Im-BCD); green = bulge
galaxies (Sa-Sb)... Contours of equal
density are given. The continuum line g-i =
-0.0585 *(Mi + 16) + 0.78 represents the empirical separation between the
red-sequence and the remaining galaxies.
The dashed line illustrates the effect of the limiting magnitude r=17.77 of the
spectroscopic SDSS database, combined with the
color of the faintest E galaxies g-r ~0.70 mag.."
|
 Figure 3 from Gavazzi+ (2010) |
| Next, let's compare the distribution of galaxies to the distribution of the hot X-ray gas. To the right is an optical image with contours of the ROSAT X-ray emission superposed. Use TOPCAT to plot the sky distribution, over the same region, of galaxies in our 2 Mpc sample with heliocentric radial velocities in the range 5850 to 7850 km/s. Plot the galaxies with optical velocities and ones with HI 21 cm velocities with different symbols so that you can see any differences in their distributions. |

Credit: GEMS Team |