SH #3: Understanding Galaxies         Group Project

Team D:       Large scale structure around the poor cluster MKW 11


As we have discussed, a galaxy's evolution depends on its environment, especially in regions of higher density like groups and clusters. In this activity, you will examine the large scale structure in the vicinity of the nearby "poor" cluster (or "rich" group) known as MKW 11. Several other teams are looking at other issues related to the local large scale structure in general and how it plays a role in galaxy surveys and the Virgo cluster in particular (Team C). Also, note that Team E is going to look at the galaxies that inhabit MKW 11, whereas your job is to understand how it fits into the structures surrounding it and to look at what a "poor cluster" is in comparison with the Coma cluster.


The cluster MKW 11

The E-S0 galaxy NGC 5171 lies at the rough center of a bunch of galaxies of similar redshift; take a look at the galaxy via the SDSS Navigator tool. Use the scale adjustment to examine the surrounding field, containg the structure known as the MKW 11 cluster which is the target of your investigation. Then use the NASA Extragalatic Database (NED) to find out some of the basic facts about MKW 11. Notice that it has numerous other names.

R.A.(J2000)  
Dec.(J2000)  
Recessional velocity in heliocentric rest frame  
Recessional velocity in CMB rest frame  
Distance to the cluster (quoted in NED)  
Galactic latitude  
Galactic extinction in g-band  
Galactic extinction in i-band  


Using the information and links in NED, learn what you can about the cluster. Here are some questions to get you started.

  •   What is a "poor" cluster?

  •   What does "MKW" stand for?

  •   What are other names for this same group?

  •   What is the basic difference between the frame B1950.0 and J2000.0?


    Getting ready to explore the environment of MKW 11

    To review the large scale structure in and around MKW 11, we can use the "Arecibo General Catalog", the private database of galaxies maintained by the Cornell EGG which is made available to members of the ALFALFA team with the usual caveat that you get what you pay for. Remind yourself what you learned about the AGC in SH#0.

    We have used the AGC to create two CSV files for use in this activity. The files contain the galaxy AGC number, RA, Dec, Vhelio and the projected separation of the galaxy from the cluster center in arcminutes. Use TOPCAT and these files to explore the structure of the cluster.


    The sky distribution of galaxies in the cluster MKW 11

    First, let's take a look at the distribution of galaxies in the vicinity of MKW 11. Using the AGC/α.40 data files (linked above), plot (on the same graph) the sky distribution of galaxies in the (a) optical sample and (b) the α.40 galaxies. Assign the optical sample red symbols and the radio 21cm line one, blue ones. Plot the optical sample first, since it is much bigger.

  •   Be sure to plot the distribution so that east is to the left and west is the right; why do we do that?

  •   Consider the result: what do you notice and how can you explain what you see?


  •   Clusters of galaxies have a typical radius of 2 Mpc. At the distance of MKW 11, what is the angular extent of 2 Mpc?


  •   Make a second plot, zooming in on the region containing the cluster itself (to 2 Mpc).

  •   Comment on what you see. Is the cluster evident in both samples (the optical one and α.40)?


    The distribution of heliocentric velocity with projected separation

    In the previous plots, we did not make use of the redshift information; it's time to do that. Using the same data files (linked above), plot (on the same graph) the variation in heliocentric velocities (y-axis) with the projected separation from the cluster center (x-axis) for the (a) optical sample (red) and (b) the α.40 galaxies (blue).

  •   What do you notice and how can you explain what you see?

  •   Why are there more red points than blue points at large heliocentric velocities?

  •   There seem to be a lot of red points at separations of greater than 200 arcminutes. Why?


    A quick comparison with the Coma cluster

    The richest cluster in the local universe is the Coma cluster, also known as Abell 1656. Look up the cluster in NED and find the same information you recorded before for MKW 11:
    R.A.(J2000)  
    Dec.(J2000)  
    Recessional velocity in heliocentric rest frame  
    Recessional velocity in CMB rest frame  
    Distance to the cluster (quoted in NED)  
    Galactic latitude  
    Galactic extinction in g-band  
    Galactic extinction in i-band  


  •   Based on the information you can find in NED, in what ways are Coma and MKW 11 similar? In what ways are they different?


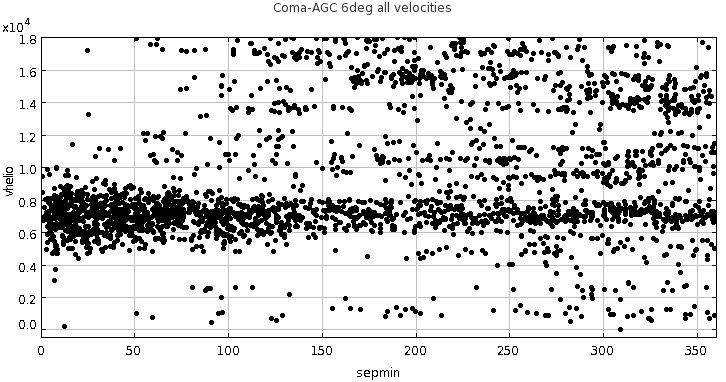
    Below is a diagram showing the distribution of heliocentric velocities for all galaxies in the EGG-AGC with measured redshifts less than 18,000 km/s found within a 6 degree radius of Coma. Compare the distribution for Coma with that for MKW 11 above.
  •   What do you notice and how can you explain what you see?

  •   In what ways are the distributions different in the inner regions of each cluster (at small separations)?

  •   What property(ies) of the two clusters might explain the difference?


    The velocity structure of MKW 11

    Now, let's focus on the cluster itself. Using the same data files again, plot (on the same graph) the distribution of heliocentric velocities (using the TOPCAT histogram option) for the (a) optical sample (red) and (b) the α.40 galaxies (blue).

  •   What do you notice and how can you explain what you see?

    Now examine just the galaxies within 2 Mpc of the cluster center. You can generate the file you need using the ROW SUBSETS option in TOPCAT.

  •   Estimate the mean velocity of the cluster and its velocity dispersion.

  •   Comment on the determination on the membership of this cluster and your ability to estimate its mean velocity and velocity dispersion.


    Another comparison with Coma

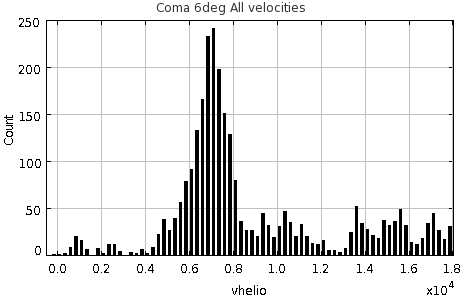
    To the right is a similar histogram made for the Coma cluster. It contains all galaxies within 6 degrees of the center of the cluster which have measured heliocentric radial velocities.

  •   Compare this histogram to the one shown above for MKW 11. Comment on the differences and possible reasons for them.


  • The MKW cluster itself

    Next focus in on the cluster itself to make a histogram of only the galaxies within 2 Mpc of MKW 11 and in the velocity range Vhelio: (5850 to 7850 km/s), for either Vopt or V21. Again, you can generate the file you need in TOPCAT.

  •   Compare this histogram to the plot of heliocentric velocity versus distance from the center of MKW 11 that we looked at before. Does it behave as you expected?

  •   How might you use this result?


    The large scale structure around MKW 11

    Now, let's examine the very large scale structure in the general surrounding of MKW 11. A convenient way to examine large scale structure is to make a "cone diagram" of an almost-2-D "slice". For this purpose, there are two more files containing galaxies in a 5 degree wide "slice" of the universe: R.A:. (7.5 to 16.5 hours), Dec: (10.5 to 15.5 deg), Vhelio: (0, 18000 km/s). In this case, we are converting RA,Dec and heliocentric velocity to "radial coordinates" radx and rady, centered on the 12 hours RA (radx=0.). As before, there are two files: In this region, there are three rich clusters of galaxies worthy of note:

    Cluster R.A.,Dec. Helio. velocity
    km/s
    Abell 999 155.8, 12.8 9683
    Abell 1016 156.8, 11.0 9653
    Abell 1142 165.23, 10.5 10463
        Values from NED


  •   Make separate cone diagrams for the galaxies with optical redshifts and the galaxies with HI redshifts. Then make one with the two superposed. What are your impressions of structure in this region?


  •   Where do the three other clusters lie in these diagrams?

  •   Consider the results: what do you notice and how can you explain what you see?


  •   Identify a filamentary structure. How long (in Mpc) is it (assuming it is real)?


  •   Identify a void in the distribution. How large (in Mpc) is it?


    Other things to consider

  •   Using the information you have and making reasonable assumptions, how could you estimate the mass of the MKW11 cluster?

  •   Investigate some other comparisons of MKW 11 to other nearby clusters in the UAT groups project.


    Last modified: Fri Jun 14 15:17:09 EDT 2019 by becky