Montage and DS9
Using DS9
What is DS9?
DS9 is software for imaging and visualizing both 2-dimensional images and multi-dimensional data cubes, and is aimed at astronomers. It's very useful for quickly making images for your own use, or for making very pretty images for publication.
I'm going to give several examples of things that can be done with DS9 with both a 2D image and 3D data cube (both can be found in /home/hatillo/ghallenbeck/misc/). This data is my EVLA observations of the HI line emission of galaxy AGC9037. The 2D image is just the zeroeth moment of the 3D data cube (where all the flux has been summed up across each channel).
On to some examples!
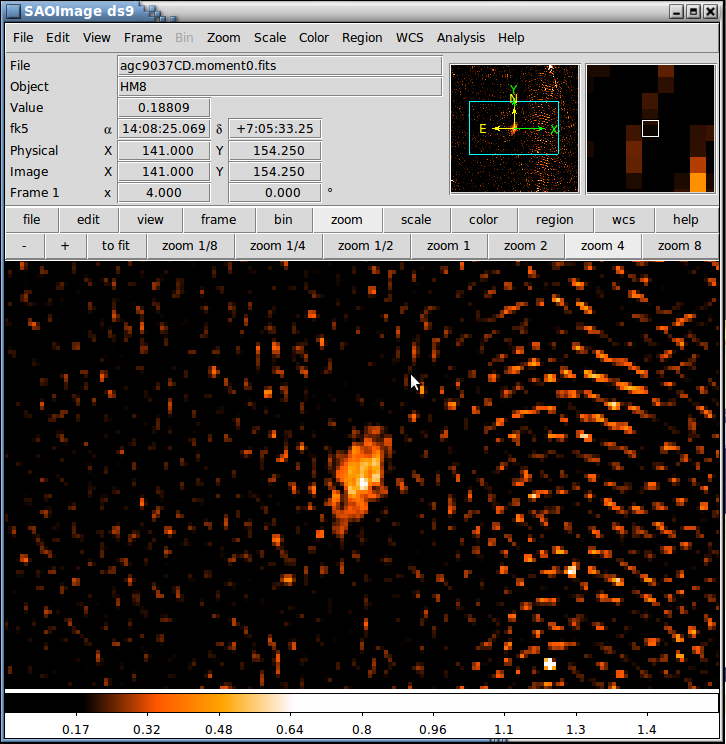
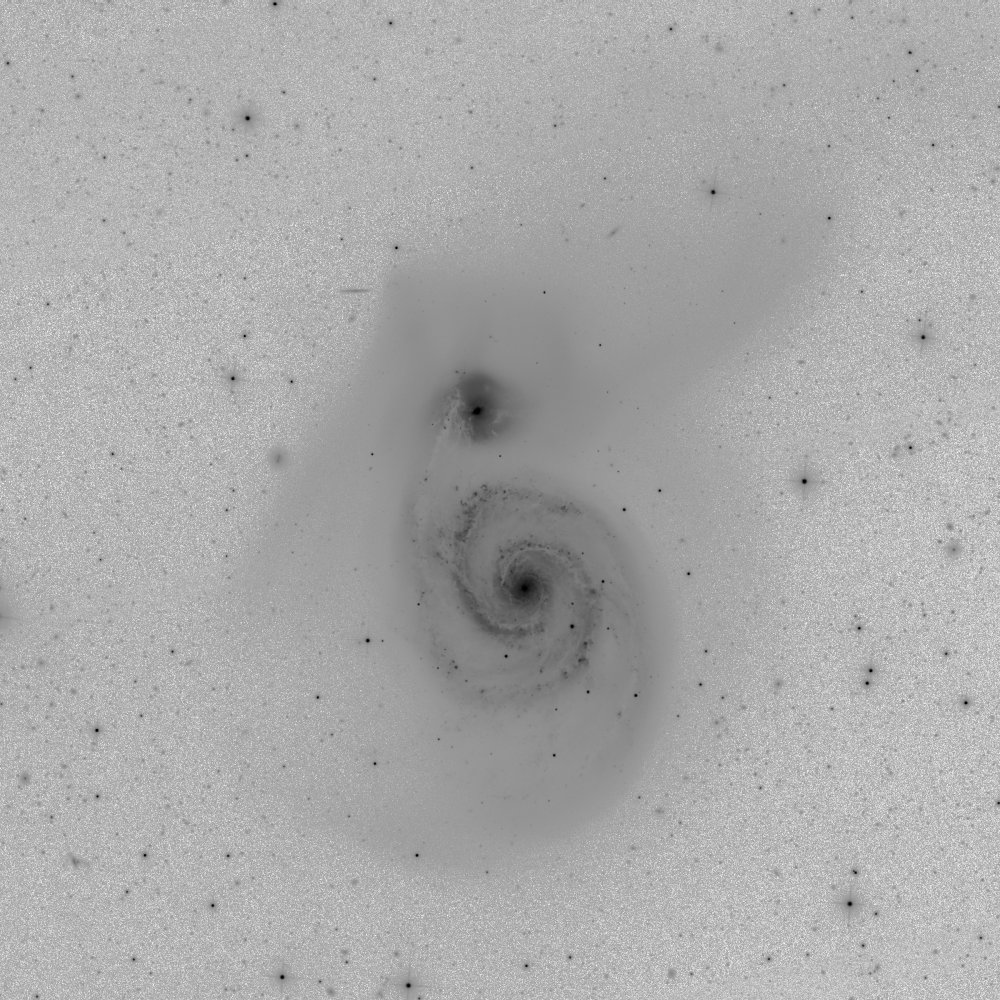
Here is my moment 0 map, after loading it in (you can right-click and drag to adjust the contrast, as I've done). This moment map is pretty bad: you can see significant ripples throughout the image. This is a combination of a poor subtraction of the continuum source (in the lower right) and either an error in calibrating the amplitudes or the phases. Luckily this is just a the rough image.
 Some things to notice:
- As you mouse over the image, the Value entry at the top lets you know the value of that particular pixel
- If you have a FITS file, the coordinate system is probably implanted in the image date. You can see the right ascension and declination beside the fk5 entry.
- There is a colorbar at the bottom of the image, helpfully letting you know what values are mapped to what colors.
Adjusting Image Appearance
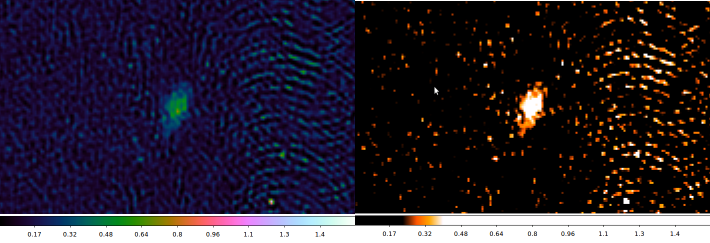
DS9 gives you many options to display your image. The Color menu lets you
switch between different color table (or import your own). Here's the lovely cubehelix-1 rainbow (left). The Scale menu lets you change how the color table is mapped to different pixel values. I've adjusted another image (right) to only show color structure over a short range, giving enhanced contrast.
 But you can do more than just use DS9 as a poor substitute for Photoshop!
Using the DS9 Image Servers
Because FITS files can contain coordinate information, We can import images from other surveys of the same object.
DS9 comes with several image servers across several wavelengths: the DSS, 2MASS, FIRST, ...
Here I've imported the galaxy in the optical from the DSS II Blue
(Analysis -> Image Serves -> ESO DSS I/II)
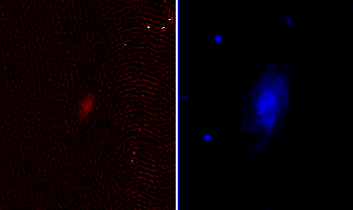
But DS9 scales these images arbitrarily. It looks like the optical emission (right) is more extended than the HI emission, but that actually isn't true. An easy way to compare images is to produce contours and overlay them. (left) I've added contours at a few times the rms in the image. (Analysis -> Contour Parameters). The contours can be saved, and then loaded onto the other frame (right) (Analysis -> Contour Parameters, then File -> Load Contours).
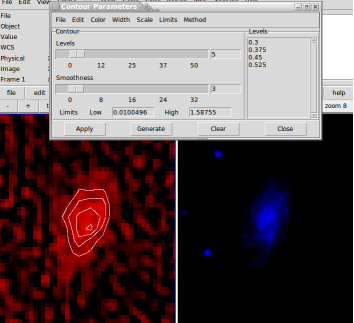
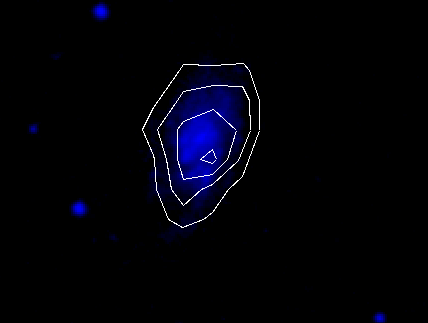
It is already apparent just from this that the peak of HI emission is not coincident with the peak of the blue light, and that the HI emission extends to the edge of the optical disk.
3D Visualization
Previously, data cubes were viewable only by stepping through them a single channel at a time, and the program treated each channel as a different image entirely. The newest release adds the ability to rotate your image cube to get different looks at the data. DS9 uses a really rudimentary ray-tracing system to produce this effect. In order to get the ability to rotate, you need to create a 3D frame, which is different from the regular frames that images are in (Frame -> New 3D Frame). Because my netbook is very slow compared to anything in the cave, I only have the patience to produce these two images:
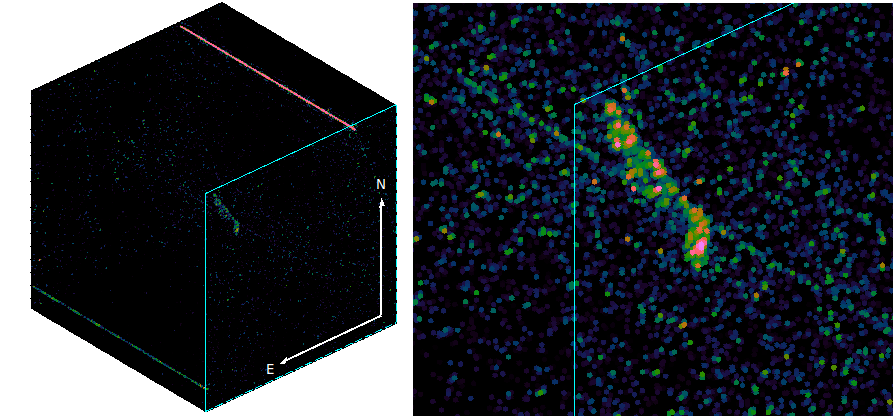
You can easily see the continuum sources that I didn't remove from the data cube properly! (they are the lines, as they are point sources appearing in all of the frequency channels)
Using Montage
What is Montage?
Montage is software which takes publicly available images (from 2MASS, WISE, SDSS, DSS... in optical bands and infrared) and mosaics them. This means that it will combine images taken over a wide, deprojects them, and perform a uniform background subtraction. Montage is available for download or can be used through a web interface. The web interface is incredibly trivial to use. Here is everything that you will need in order to get images back from Montage:
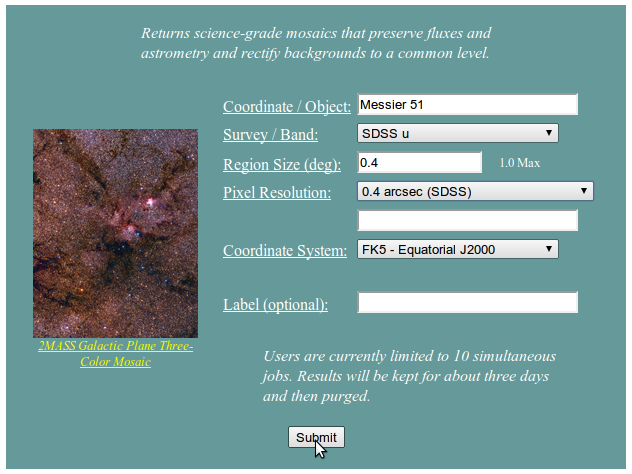
And you will be sent an email when the task is complete, and you can download your image. Here is mine:
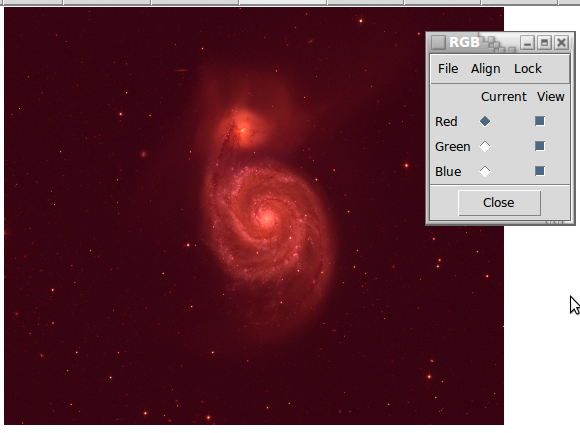
Because Montage has access to many different bands, you can combine your images from Montage into false-color images using DS9. Make sure to make a new frame with Frame -> New RGB Frame. Here is the above image with the SDSS r, g, and u-bands in the R, G, and B color channels: