Introduction to ALFALFA grids and catalog data
- ALFALFA grids and catalogs
Here is a small subset of the ALFALFA catalog containing the currently available spring data south of Dec < +04 degrees. Additionally, here are some screen shots of LOVEDATA screens of two objects contained in the subcatalog. Refer to this subcatalog and these figures in answering the following questions. a. The HI profile is often two-horned. Sometimes it has a Gaussian shape. Under what circumstances would be expect to see a Gaussian shape, rather than the characteristic two horns? b. How is the profile width, W50, measured on a two-horned profile? c. What is meant by "rms"? d. What is meant by "SN"? e. In the GRIDVIEW displays, what causes the patterns of dark blue dots in the right hand panel? f. What is the HI source name of AGC214473? g. Why isn't the "position" in the HI source name the same as the "ellipse center" position? h. What grid contains AGC 214473? i. What is the HI mass of AGC 214473? j. What is the heliocentric velocity of HI123117.1+035049? k. What is unusual about AGC 227983? l. There are 3 HI emission features in the GALCAT display of the spectrum of AGC 227983. What do they arise from? 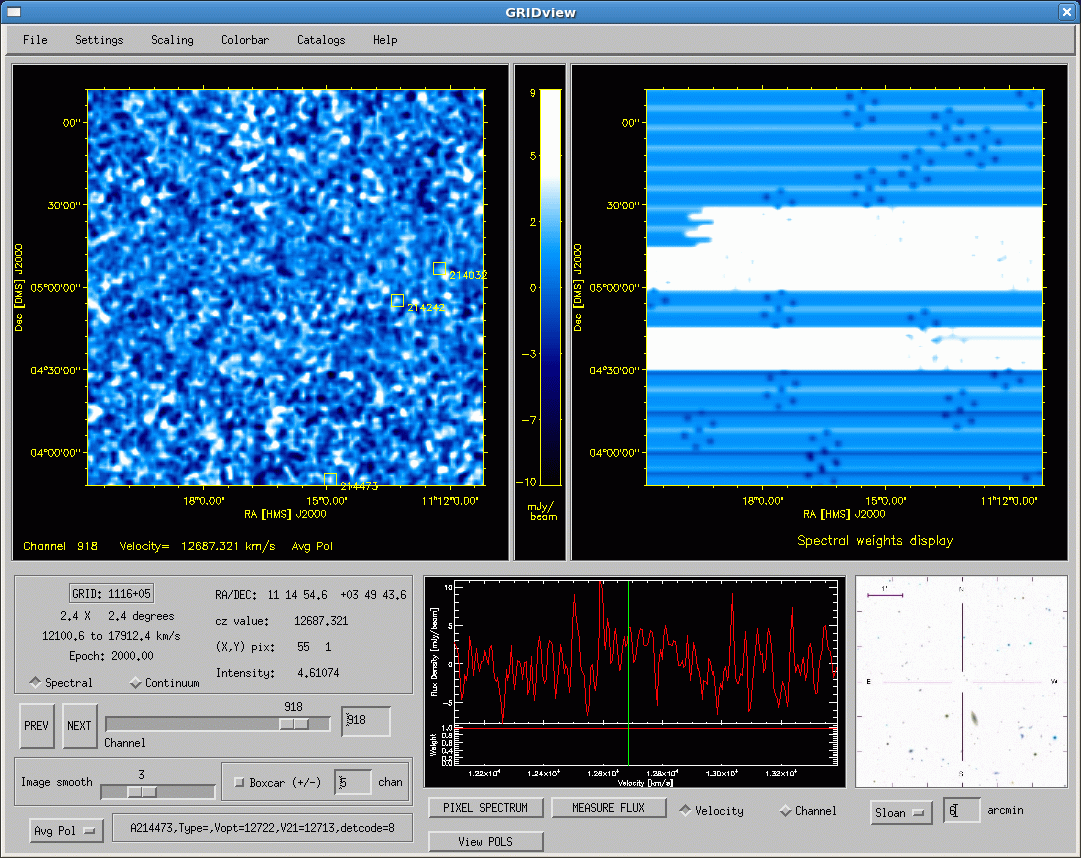
A214473 GRIDVIEW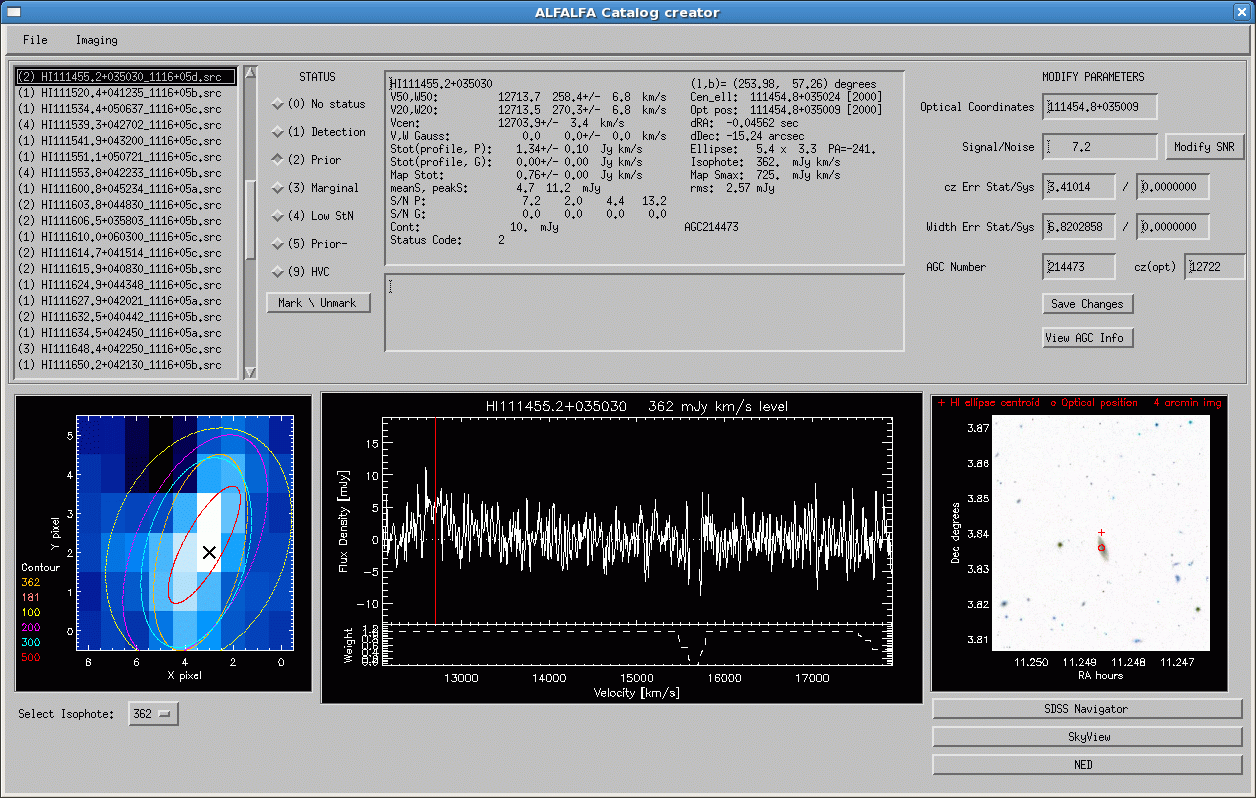
A214473 GALCAT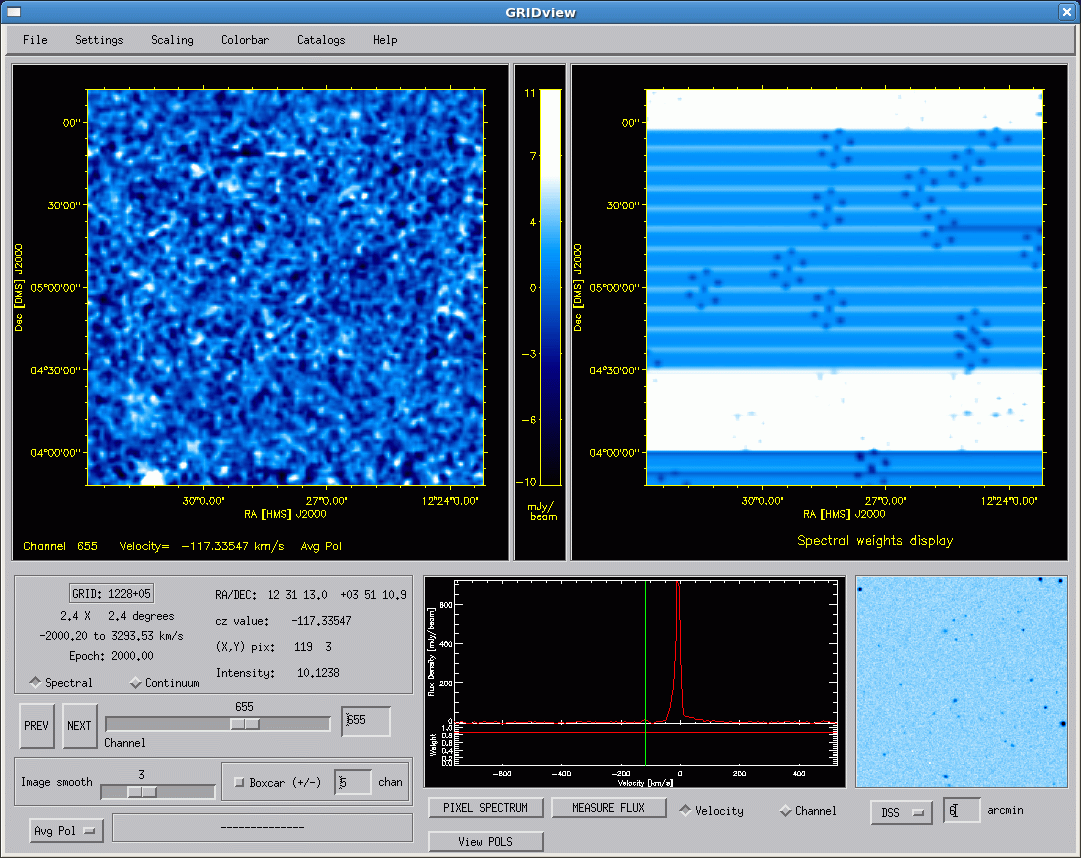
A227983 GRIDVIEW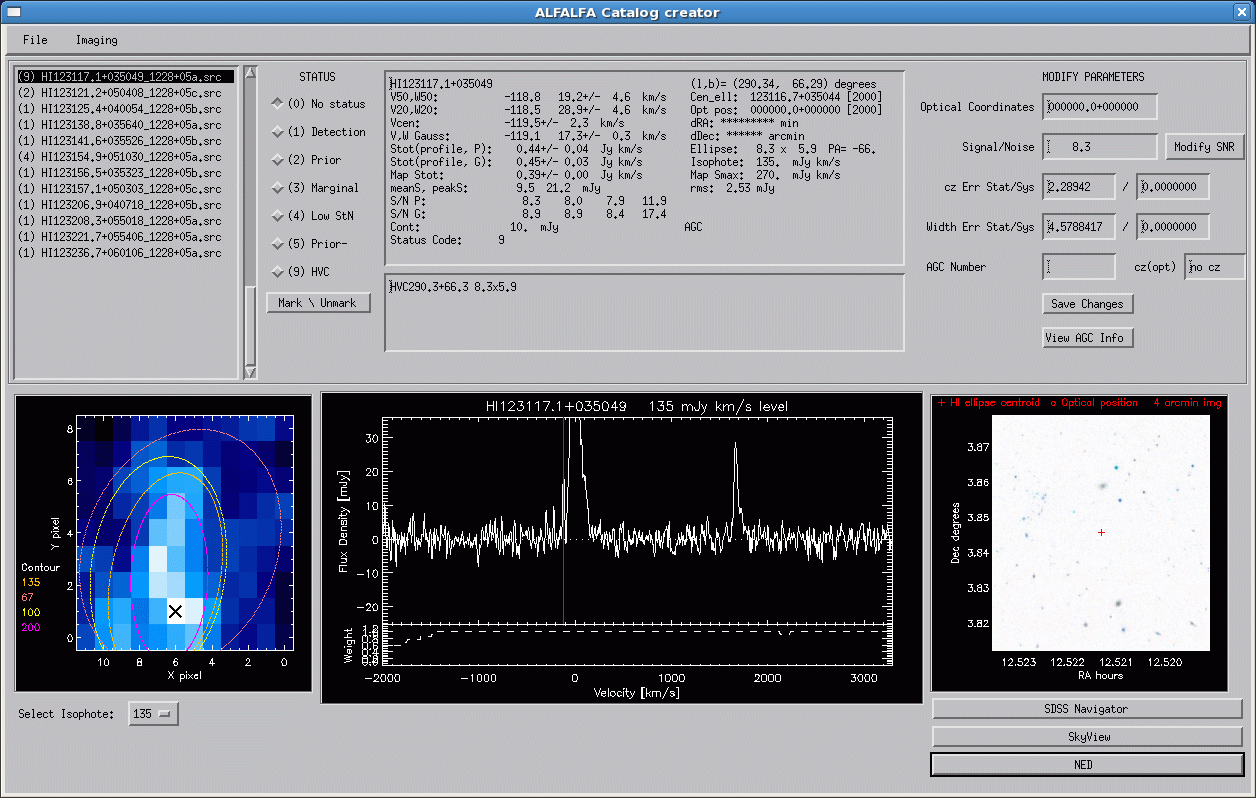
A227983 GALCAT
- Identifying the most probable optical counterpart.
One of the most important extra contributions of ALFALFA and an integral part of
the source extraction process
is the identification of the most probable optical counterpart to each HI
source -- where such
exists. Since ALFALFA galaxies don't care that we are observing them only in the
HI 21 cm line, we need
to know if they have a stellar component. And since ALFALFA data cubes have a re
solution of about 4 arcminutes,
we need to know when the detection is clearly associated with a galaxy -- or not
!. If a source does not have an optical counterpart and is not a high velocity c
loud, then it is a candidate OH megamaser or
a candidate "dark galaxy".... or an evil spurious detection (aaarrgg!)
The practice of identifying the most probable optical counterpart adds considerably to the effort of
construction ALFALFA source catalogs. It is easier said than done. It requires astronomer intelligence,
which is unfortunately why we cannot train our cats to produce catalogs (otherwise, we sure would have!).
a. Upon what factors does the ability to centroid a source observed with any telescope depend?
b. On average, how accurately are we able to measure the position of the centroid of an ALFALFA detection?
c. The table below presents five ALFALFA detections; given are parameters extracted from the HI measurement. Find the
most probably optical counterpart. Use the tools you have learned about before to examine
useful optical databases.
HI centroid (J2000) HI flux cz W50 SN OC coordinates Your comments 014106.4+271903 0.69 274 26 13.1 095452.2+142907 0.61 12557 117 7.3 123120.9+050402 0.65 9873 151 4.9 152240.3+055017 0.44 1796 24 9.0 160745.2+272220 0.89 7602 84 10.9
- Exploring the SDSS
To estimate the total dynamical mass of a galaxy, we need to make use of optical
and HI line data. Let's explore the object mentioned above AGC 214473.
For starters, let's find the image
and some basic SDSS data on this galaxy.
a. Describe the appearance of the galaxy in the SDSS image
b. What is the rest wavelength of the strongest emission line seen in its spectrum?
c. How much brighter is the galaxy in the r-band than in the u-band?
d. Then go to the
SQL for DR7
amd run the SQL query below:
What is the angular diameter of the galaxy in kpc? e. What is the inclination of the galaxy? Explain how you get your answer. f. Using the information you have available, calculate the rotational velocity of the galaxy? g. Then calculate the dynamical mass of the galaxy, in solar units. What assumptions do you have to make? h. What fraction of the galaxy's total mass is made up of HI?SELECT p.ra, p.dec,s.z,s.zerr,p.petroR90_r,p.expAB_r, p.petroMag_u,p.petroMag_r, p.objID FROM PhotoObj p, SpecObj s, SpecLine l WHERE p.SpecObjID = s.SpecObjID AND p.SpecObjID = l.specobjID AND s.specClass=2 AND l.lineID = dbo.fSpecLineNames('Ha_6565') AND p.objID=588010358007595145
- Distances: Hubble's Law doesn't always work!
a. What is the redshift of M31, the Andromeda galaxy?
b. What is the distance to M31? Give you answer in both light years and Mpc.
c. UGC 7470 = IC 3258 is detected by ALFALFA with a heliocentric velocity
of -430 km/s. What is its probable distance?
d. What is the motion of the Sun with respect to the frame of rest of
the Cosmic Microwave Background radiation?
e. UGC 8155 is found at (RA,Dec) = (130314.2,+074820). Its heliocentric
velocity is 2922 km/s. How do you calculate its distance? (Looking in
NED won't cut it; suppose you have 15000 galaxies; how are you going to
calculate distances to all of them?).
f. AGC 220977 is found at (RA,Dec) = (124412.0,+125630). Its heliocentric
velocity is 875 km/s. What is its distance?
- Galaxies cluster!
Here are two diagrams of the current AGC redshift distribution in the sky area that will be contained in the future ALFALFA spring sky +03o grids. The slices shown are bounded by 07h30m < R.A. < 16h30m and +01.75o < Dec. < +04.25o. The velocities here are heliocentric. Blue points illustrate the locations of galaxies of known redshift; filled red circles mark ones with (current) HI data. ALFALFA will add to both these diagrams. Refer to the diagrams in answering the following questions. Note: since the ALFALFA results are not yet available, there aren't very many red points in these diagrams! Next year, they will look much richer, especially the lower one.
a. Identify the clusters in the distribution and find their matches in the NED b. Identify a filamentary structure. How long (in Mpc) is it (assuming it is real)? c. Estimate the size (in Mpc) of the apparent void centered at R.A. ~9h20m, cz ~ 14000 km/s.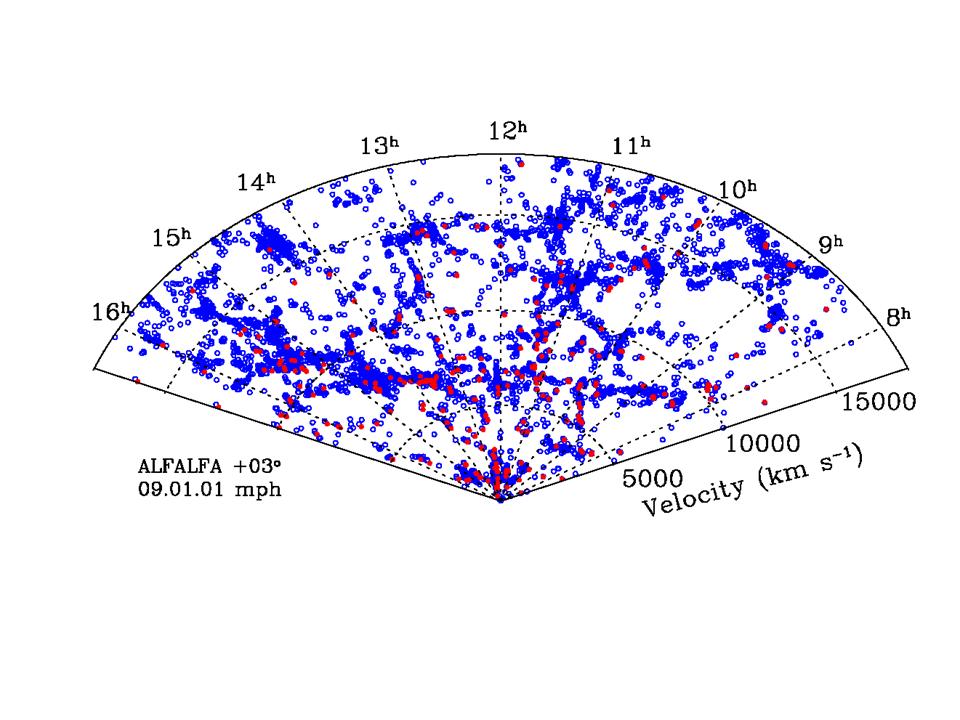
Cone diagram of the full ALFALFA velocity range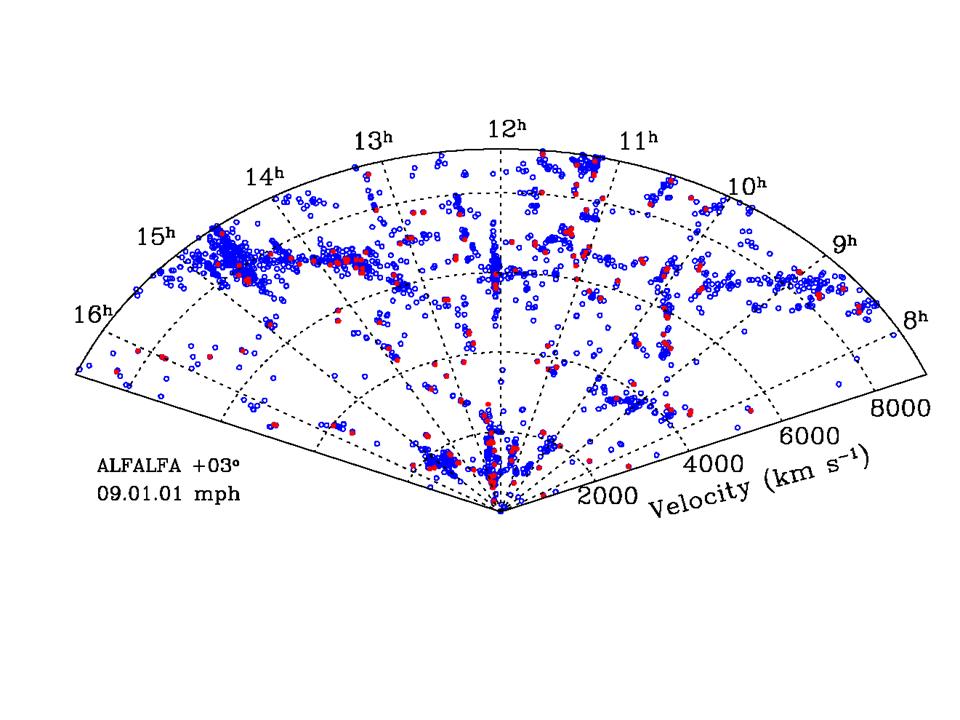
Cone diagram of the inner 9000 kms/s
More practice questions:
